I have an odd problem where I am specifying two horizontal points where I would like minor xticks and for some reason, the last point is being truncated.
import matplotlib.pyplot as plt

x_c_h = 17.
x_c_l = 20.

ax = plt.axes()

plt.axvline(x_c_h,color='k',linestyle='--')
plt.axvline(x_c_l,color='k',linestyle='--')

ax.set_xticks([x_c_h,x_c_l,], minor=True)
ax.set_xticklabels(['$x_c^h$', '$x_c^l$'], minor=True)
ax.tick_params('x', which='minor', top=True, length=0,
               labeltop=True, labelbottom=False)

ax.tick_params('x', which='major', labelleft=False,
               labelbottom=False, length=0)
ax.tick_params('y', which='major', labelleft=False,
               labelbottom=False, length=0)

plt.xlim(0, 25)
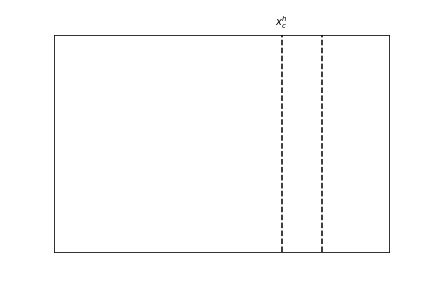
ax.get_xticks(minor=True)
[17.0]

[tickl for tickl in ax.get_xminorticklabels()]
[Text(17.0, 1, '$x_c^h$')]
This also seems to be a problem where I have more minor xticks where x_c_l is the final item in the list.
Any suggestions for fixing this? I’m on matplotlib version 3.2.2.
Thanks!