Friends,
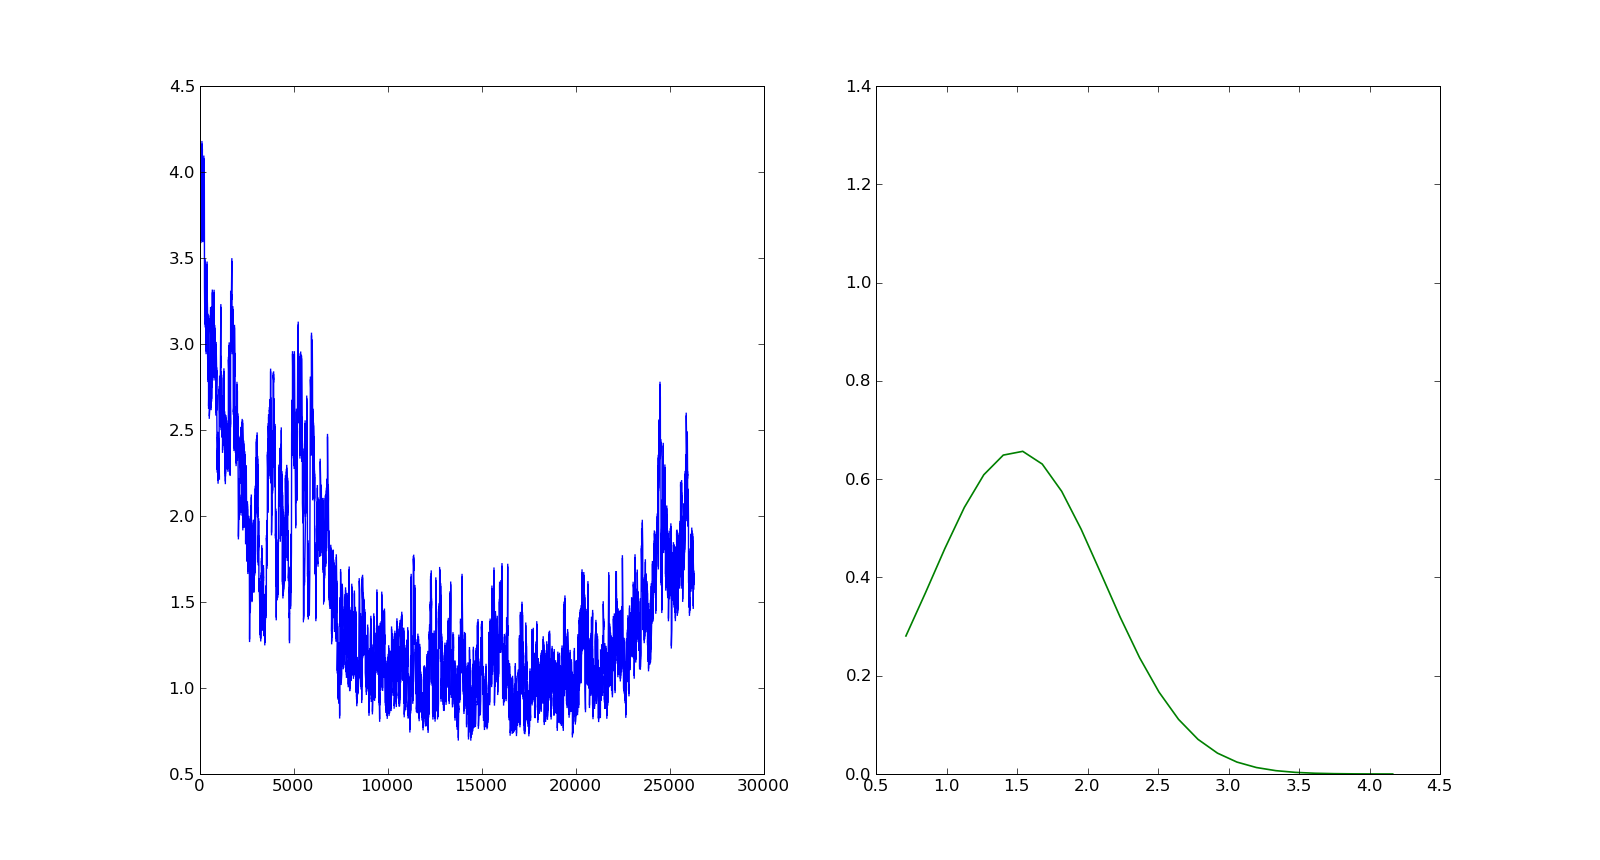
I wrote a small script to plot a data and its pdf in single figure but as two subplots.
-
However i want to share xaxis of ax2 (subplot 122) with the y axis of ax1 (subplot 121). What function should i use do that. I tried sharex and sharey but i am not gettting what i want.
-
Is there any possiblity to one of the subplot for instance i want to rotate ax2 by 90.
#!/usr/bin/env python
import matplotlib.pyplot as plt
import numpy as np
import matplotlib.mlab as mlb
data1=np.loadtxt(‘test.rms’,usecols=(1,))
fig=plt.figure()
ax1=fig.add_subplot(121)
ax2=fig.add_subplot(122)
ax1.plot(data1)
mu,sigma=np.mean(data1),np.std(data1)
n, bins, patches = ax2.hist(data1, bins=25, normed=1, facecolor=‘green’, alpha=0.75,visible=False)
y = mlb.normpdf( bins, mu, sigma)
l = ax2.plot(bins,y,‘-’,linewidth=1.2)
plt.show()
Hi Bala,
I attached a small stand-alone example, which illustrates two ways of showing
data and its pdf sharing one axis. Maybe this can serve as a starting point
for you to solve the problem or you can describe in more detail what is
missing.
Kind regards,
Matthias
data_and_its_pdf.py (889 Bytes)
···
On Thursday July 29 2010 12:05:24 Bala subramanian wrote:
Friends,
I wrote a small script to plot a data and its pdf in single figure but as
two subplots.
1) However i want to share xaxis of ax2 (subplot 122) with the y axis of
ax1 (subplot 121). What function should i use do that. I tried sharex and
sharey but i am not gettting what i want.
2) Is there any possiblity to one of the subplot for instance i want to
rotate ax2 by 90.
#!/usr/bin/env python
import matplotlib.pyplot as plt
import numpy as np
import matplotlib.mlab as mlb
data1=np.loadtxt('test.rms',usecols=(1,))
fig=plt.figure()
ax1=fig.add_subplot(121)
ax2=fig.add_subplot(122)
ax1.plot(data1)
mu,sigma=np.mean(data1),np.std(data1)
n, bins, patches = ax2.hist(data1, bins=25, normed=1, facecolor='green',
alpha=0.75,visible=False)
y = mlb.normpdf( bins, mu, sigma)
l = ax2.plot(bins,y,'-',linewidth=1.2)
plt.show()
Actually, I think Bala is asking for something different, and I while I think matplotlib is capable of doing it, I am not aware of any easy-to-use function to do it. Currently, you can share a pair of x axes, or a pair of y axes. This is fairly straight-forward because the axes object returned from a .add_subplot() command contains both axis objects, and you can easily pass in another axes object to the sharex or sharey keyword arguments. Those sharex and sharey arguments assume that you mean to pair-up the x axis of the two axes objects, or the y axis of the two axes objects. However, what we want here is the ability to have the x axis in one axes object to be paired with the y axis of another axes object. This is a completely different, but valid, use-case and would be a useful feature to make available (or at least, better documented).
Ben Root
···
On Thu, Jul 29, 2010 at 10:07 AM, Matthias Michler <MatthiasMichler@…361…> wrote:
On Thursday July 29 2010 12:05:24 Bala subramanian wrote:
Friends,
I wrote a small script to plot a data and its pdf in single figure but as
two subplots.
- However i want to share xaxis of ax2 (subplot 122) with the y axis of
ax1 (subplot 121). What function should i use do that. I tried sharex and
sharey but i am not gettting what i want.
- Is there any possiblity to one of the subplot for instance i want to
rotate ax2 by 90.
#!/usr/bin/env python
import matplotlib.pyplot as plt
import numpy as np
import matplotlib.mlab as mlb
data1=np.loadtxt(‘test.rms’,usecols=(1,))
fig=plt.figure()
ax1=fig.add_subplot(121)
ax2=fig.add_subplot(122)
ax1.plot(data1)
mu,sigma=np.mean(data1),np.std(data1)
n, bins, patches = ax2.hist(data1, bins=25, normed=1, facecolor=‘green’,
alpha=0.75,visible=False)
y = mlb.normpdf( bins, mu, sigma)
l = ax2.plot(bins,y,‘-’,linewidth=1.2)
plt.show()
Hi Bala,
I attached a small stand-alone example, which illustrates two ways of showing
data and its pdf sharing one axis. Maybe this can serve as a starting point
for you to solve the problem or you can describe in more detail what is
missing.
Kind regards,
Matthias