Hi,
I wanted to be more clear:
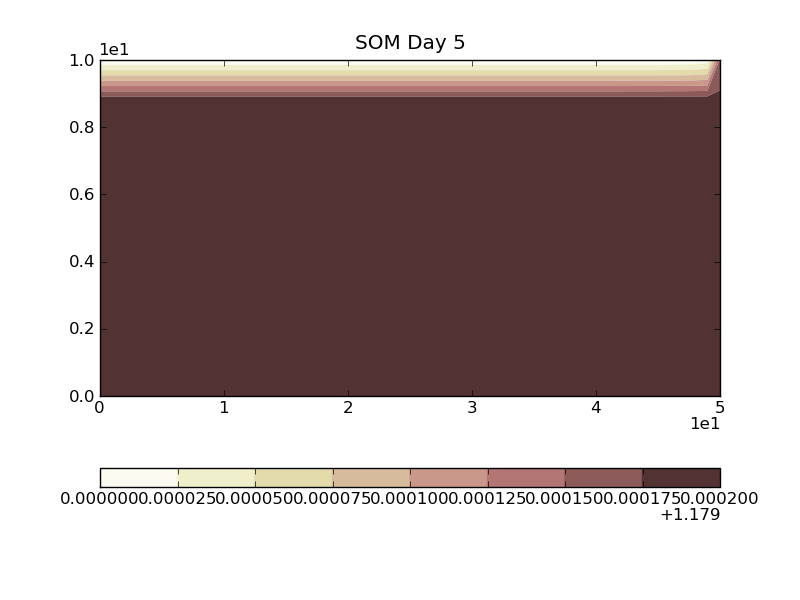
the numbers on my figure's color bar range from 0 to 1.7,
but mpl writes the following numbers:
0.0000, 0.000250,0.000050,0.000750,
etc.
This is totally not somthing I can use, it looks horrible.
I'm also attaching the image ...
···
--
Oz Nahum
Graduate Student
Zentrum für Angewandte Geologie
Universität Tübingen
---
Imagine there's no countries
it isn't hard to do
Nothing to kill or die for
And no religion too
Imagine all the people
Living life in peace
this list configuration got me again ...
2010/6/1 Oz Nahum <[email protected]...>:
the numbers on my figure's color bar range from 0 to 1.7,
but mpl writes the following numbers:
0.0000, 0.000250,0.000050,0.000750,
etc.
This is totally not somthing I can use, it looks horrible.
What do you mean by
the numbers on my figure's color bar range from 0 to 1.7
? Actually the colorbar in your pic ranges from 1.179 + 0.000000 to
1.1792 = 1.179 + 0.000200
Hmm, so I guess ScalarFormatter is already used and does its best job
already. The notation chosen is at least not erratic or random.
You can modify the data to suit plotting needs or modify the plotting
rules by writing a simple own formatter.
Friedrich