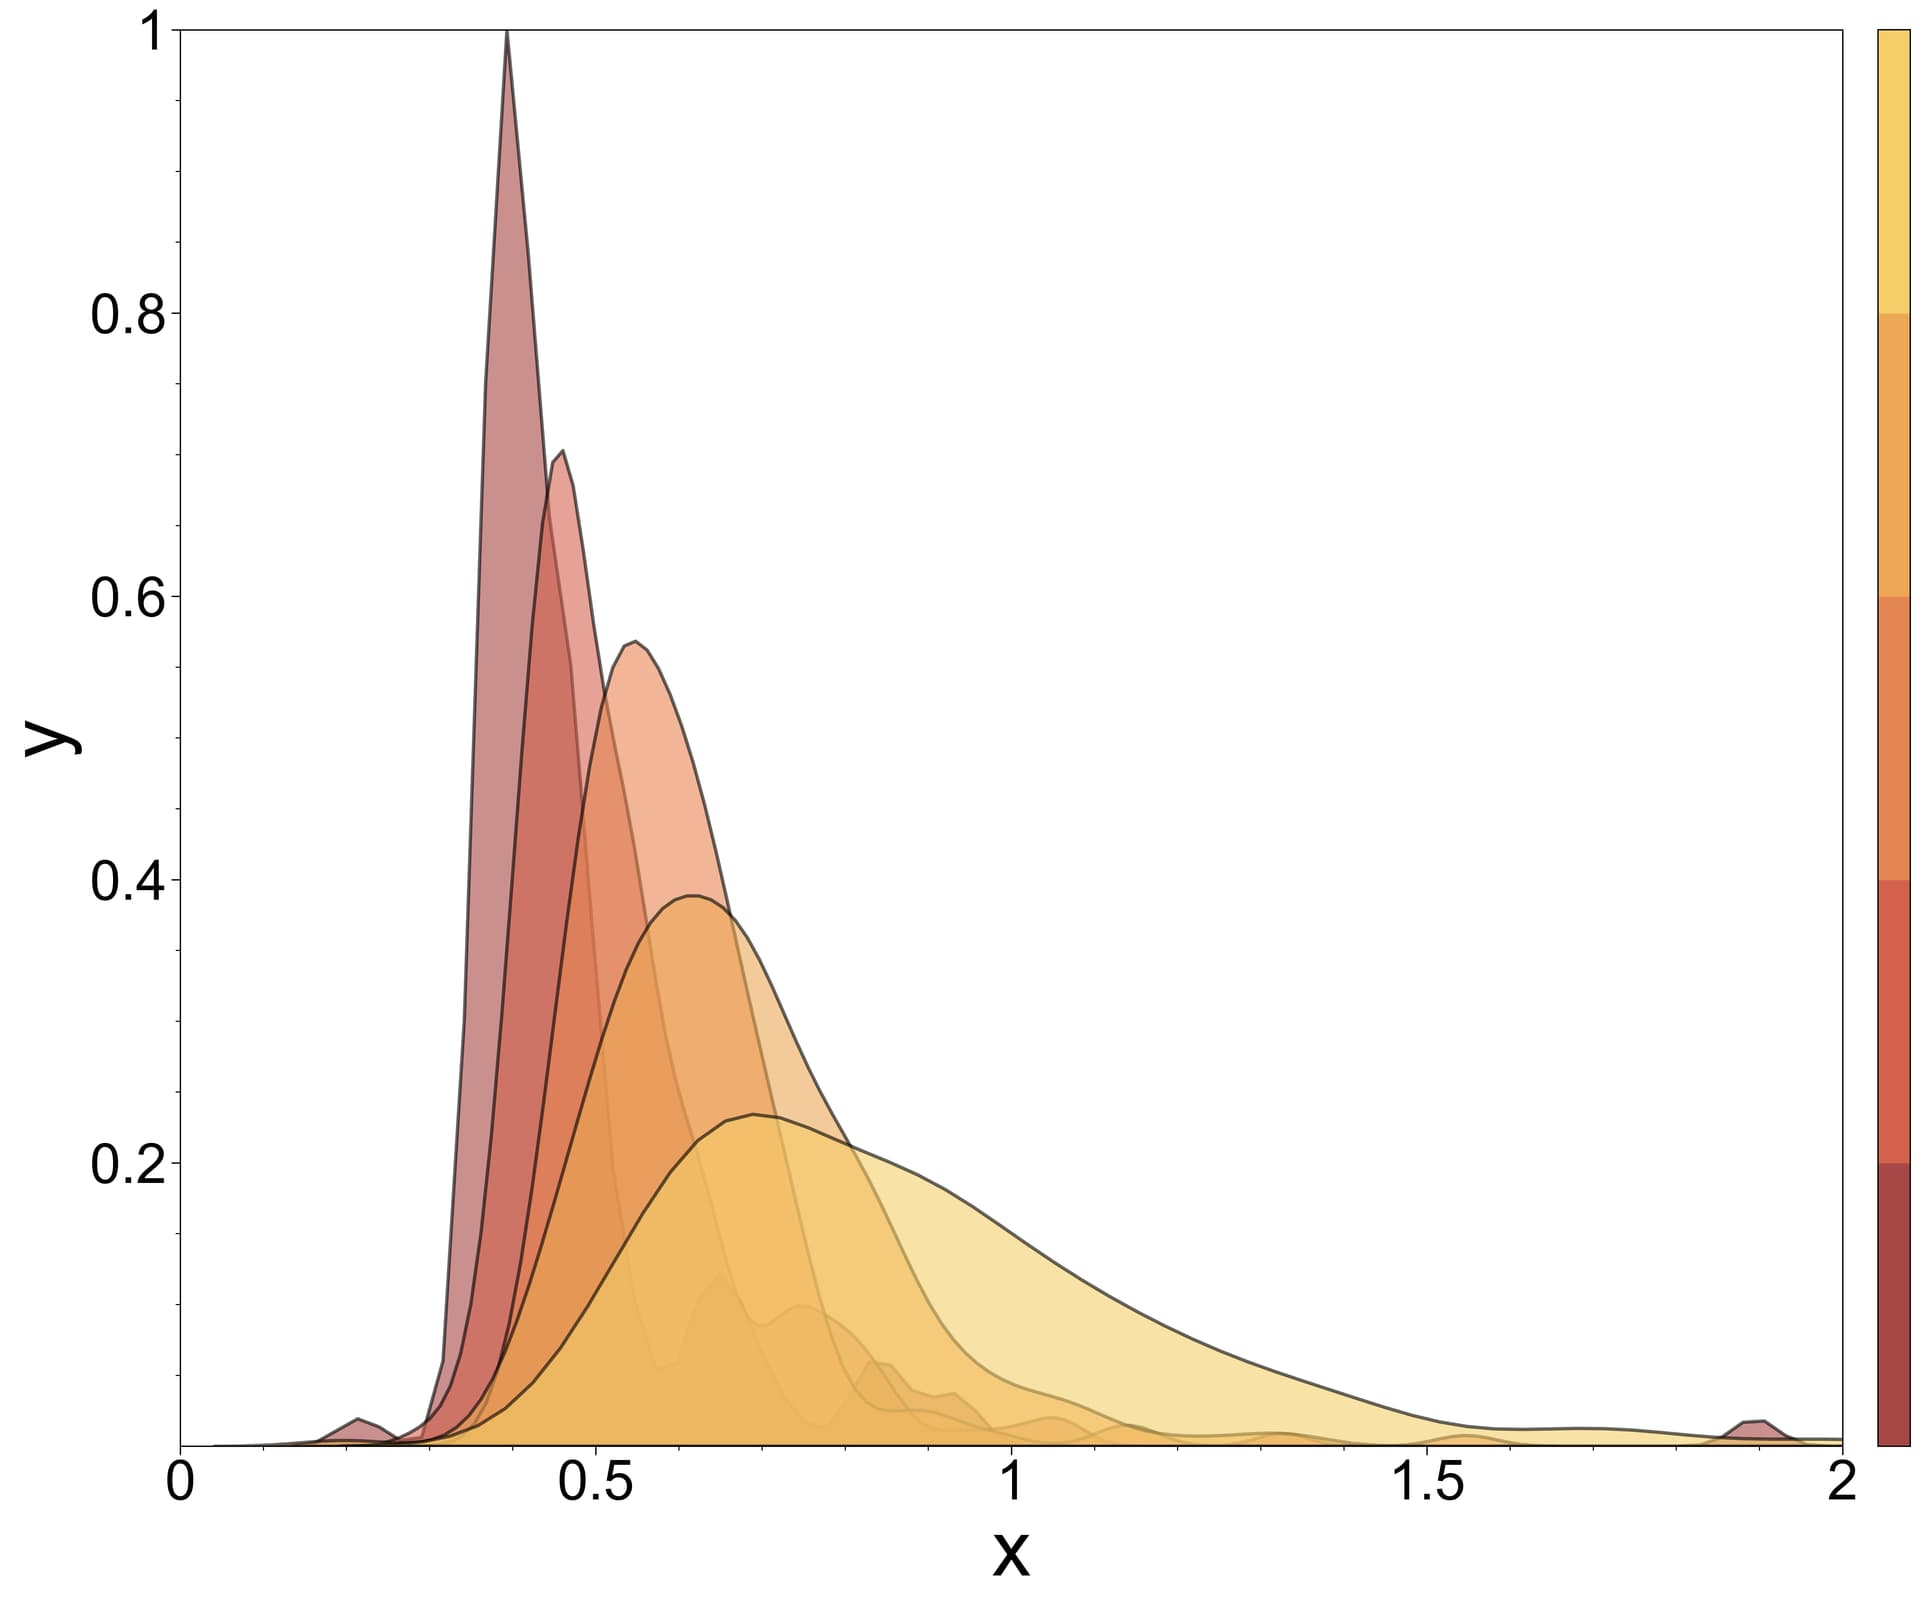
I have a series of histograms that I plot over the top of each other using a for loop:
import matplotlib as plt
import proplot as pplt
cmap = colormap
fig = pplt.figure(figsize=(12, 10), dpi=300)
jj = [ 4, 3, 2, 1, 0]

for j in jj:

     plt.fill_between(p[:,j], s[:, j], y2=0, alpha = 0.6, color = colormap[:,4-j], edgecolor=[0,0,0], linewidth=1.5)
The colormap in question is a manually specified list of RGB triplets (from Fabio Crameri’s ‘lajolla’ map) (read as columns in this matrix):
`0.64566    0.823453    0.895061    0.924676    0.957142`

`0.277907   0.386042    0.526882    0.657688    0.803006`

`0.259453   0.301045    0.317257    0.331596    0.408285`
Each color corresponds to data recorded under different conditions. I want the colorbar to have manually specified ticks corresponding to this variable (e.g. c = 30, 35, 40, 45, 50), but I can’t seem to configure the colormap to not just pull the indices of the cmap matrix (0, 1, 2, 3, 4) as the values of the mapped variable. Trying to set the ticks outside of this range just result in them not being shown.
cbar = fig.colorbar(np.transpose(cmap))
cbar.set_ticks([30, 35, 40, 45, 50])
cbar.set_ticklabels([30, 35, 40, 45, 50])
Is there a way to manually specify, or shift the indices of the colour map such that it maps to this ‘c’ variable?