Scrollbars and subplots..

Thanks for your helpful response.

I used wx, I’m mystified to as how to make the scroll bars bound the subplot. not the frame. The gtk example you pointed me to creates horizontal and vertical scrollbars around the whole frame, not within the subplot. i.e., if the subplot is very large , scrollbars bounding the subplot would be great…

Below is a sample of the code I attempted, let me know if I would need to make any corrections to it :

import wx
from matplotlib.axes import Subplot
from matplotlib.figure import Figure
from matplotlib.numerix import arange, sin, pi

class ScrollbarFrame(wx.Frame):
def init(self):
wx.Frame.init(self, None, -1, ‘Scrollbar example’,size=(300,200))
print “self”
print self

     self.scroll = wx.ScrolledWindow(self, -1)
      print "self.scroll"
      print self.scroll
      self.figure = Figure(figsize=(5,4), dpi=100)
      self.axes = self.figure.add_subplot(111)
      t = arange(0.0,3.0,0.01)
      s = sin(2*pi*t)
      self.axes.plot(t,s)
      self.canvas = FigureCanvas(self, -1, self.figure)
      self.scroll.SetScrollbars(5,5,600,400)
      #self.scroll.FitInside()

if name == ‘main’:
app = wx.PySimpleApp()

frame = ScrollbarFrame()
frame.Show()
app.MainLoop()

Thanks,
iyer

···

John Hunter <jdh2358@…287…> wrote:

On 3/19/07, lazardo wrote:

I’m curious … how can we include a scrollbar with a subplot, instead of the
back and front arrows to view the subplot. Googling
matplotlib+scrollbar+subplot brings up a very few results, so I guess it
hasn’t been attempted before.

The exact details depend on your GUI – there is no generic support
for this in pylab but since you can embed matplotlib in the GUI widget
of your choice it is certainly possible. Below is a gtk example
embedding_in_gtk3.py from the matplotlib examples directory

import gtk

from matplotlib.axes import Subplot
from matplotlib.figure import Figure
from matplotlib.numerix import arange, sin, pi

uncomment to select /GTK/GTKAgg/GTKCairo

#from matplotlib.backends.backend_gtk import FigureCanvasGTK as FigureCanvas
from matplotlib.backends.backend_gtkagg import FigureCanvasGTKAgg as
FigureCanvas
#from matplotlib.backends.backend_gtkcairo import FigureCanvasGTKCairo
as FigureCanvas

win = gtk.Window()
win.connect(“destroy”, lambda x: gtk.main_quit())
win.set_default_size(400,300)
win.set_title(“Embedding in GTK”)

f = Figure(figsize=(5,4), dpi=100)
a = f.add_subplot(111)
t = arange(0.0,3.0,0.01)
s = sin(2pit)
a.plot(t,s)

sw = gtk.ScrolledWindow()
win.add (sw)

A scrolled window border goes outside the scrollbars and viewport

sw.set_border_width (10)

policy: ALWAYS, AUTOMATIC, NEVER
sw.set_policy (hscrollbar_policy=gtk.POLICY_AUTOMATIC,
vscrollbar_policy=gtk.POLICY_ALWAYS)

canvas = FigureCanvas(f) # a gtk.DrawingArea
canvas.set_size_request(800,600)
sw.add_with_viewport (canvas)

win.show_all()
gtk.main()


Don’t pick lemons.

See all the new 2007 cars at Yahoo! Autos.
This is not possible. The subplot is not a GUI widget in matplotlib,
it is part of the entire FigureCanvas, which is a widget. You can
make the Axes take up all of the figure area if you want

ax = axes([0,1,0,1])

but then you will not see you tick labels and axis labels as they will
be outside the canvas area....

JDH

···

On 3/26/07, lazardo <maseriyer@...9...> wrote:

Thanks for your helpful response.

I used wx, I'm mystified to as how to make the scroll bars bound the
subplot. not the frame. The gtk example you pointed me to creates horizontal
and vertical scrollbars around the whole frame, not within the subplot.
i.e., if the subplot is very large , scrollbars bounding the subplot would
be great..

That’s unfortunate that a subplot cannot be bounded within a scrollbar… I guess if it could be possible to turn a subplot into a GUI widget and have GUI widgets over another GUI widget (the frame), that’d be good…

I was wondering how we can differentiate between data on a subplot and the background. i.e, if there is a subplot such as:

···

____/_ |
/ \ |
\ |
_________________________________|
what could be the best way to predict where the subplot starts and ends ?
thanx, iyer

John Hunter <jdh2358@…287…> wrote:

On 3/26/07, lazardo wrote:

Thanks for your helpful response.

I used wx, I’m mystified to as how to make the scroll bars bound the
subplot. not the frame. The gtk example you pointed me to creates horizontal
and vertical scrollbars around the whole frame, not within the subplot.

i.e., if the subplot is very large , scrollbars bounding the subplot would

be great…

This is not possible. The subplot is not a GUI widget in matplotlib,
it is part of the entire FigureCanvas, which is a widget. You can
make the Axes take up all of the figure area if you want

ax = axes([0,1,0,1])

but then you will not see you tick labels and axis labels as they will
be outside the canvas area…

JDH


Bored stiff? Loosen up…
Download and play hundreds of games for free on Yahoo! Games.

That's unfortunate that a subplot cannot be bounded within a scrollbar.. I guess if it could be possible to turn a subplot into a GUI widget and have GUI widgets over another GUI widget (the frame), that'd be good...

I think that wouldn't be good at all, for a simple reason: matplotlib has no way of calculating how big a figure or subplot should be. Instead, it's up to the programmer to determine what the appropriate size is. It can also be tedious and error-prone to do fixed layouts with stacked widgets, depending on the GUI toolkit you're using.

Because plotting is so flexible and matplotlib supports so many kinds of plots, I believe it would hard to come up with general algorithm to determine how big to make a figure or subplot. It gets even more complicated if you start considering things like resolution independent plotting -- different operating systems and displays can have dots-per-inch ratios and PNG or PS files will almost certainly have different DPIs than the graphical displays.

I was wondering how we can differentiate between data on a subplot and the background. i.e, if there is a subplot such as:

_________________________________
> ______/\___ |
> / \ |
> \ |
>_________________________________|

what could be the best way to predict where the subplot starts and ends ?

I'm afraid I can't read your diagram at all... Mac Mail might have mangled it.

Personally, I think you ought to reconsider how you're designing your application. Scrolling subplots sounds like a really confusing interface to me. I think you might be a lot happier zooming in on interesting things with a mouse or splitting your plots up into multiple separate figures.

Ken

···

On Mar 29, 2007, at 10:55 AM, Iyer wrote:

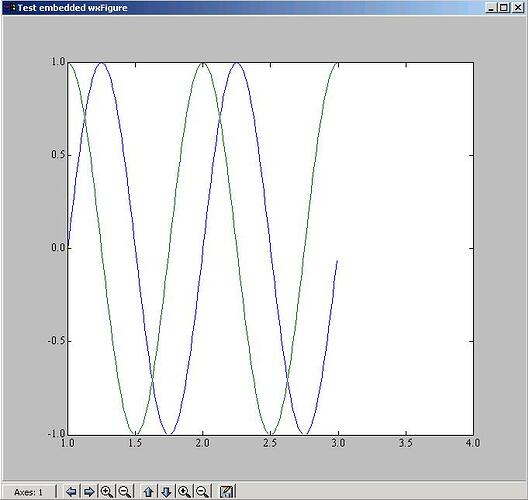
Thanks for your response, what I’m trying to find - is a way to have the whole subplot stop displaying non-data related parts of it, like when we use the back and forward arrows on the matplotlib toolbar, the subplot goes off the boundaries and can display as white space (or the color of the subplot background)… Please find attached an image - hope this will better illustrate what I was trying to convey. If the subplot in the image stops “scrolling” or rolling when it’s boundaries are reached, it would be nice. I was trying to find if the whole subplot could be enclosed within a scrollbar, JDH says that is not possible.

Any ideas ? Let me know if this needs more detail…
-iyer

···

Ken McIvor <mcivor@…612…> wrote:

On Mar 29, 2007, at 10:55 AM, Iyer wrote:

I was wondering how we can differentiate between data on a subplot
and the background. i.e, if there is a subplot such as:


____/_ |
/

_________________________________|

what could be the best way to predict where the subplot starts and
ends ?

I’m afraid I can’t read your diagram at all… Mac Mail might have
mangled it.

Personally, I think you ought to reconsider how you’re designing your
application. Scrolling subplots sounds like a really confusing
interface to me. I think you might be a lot happier zooming in on
interesting
things with a mouse or splitting your plots up into
multiple separate figures.

Ken


Now that’s room service! Choose from over 150,000 hotels
in 45,000 destinations on Yahoo! Travel
to find your fit.

Thanks for your response, what I'm trying to find - is a way to have the whole subplot stop displaying non-data related parts of it, like when we use the back and forward arrows on the matplotlib toolbar, the subplot goes off the boundaries and can display as white space (or the color of the subplot background).

Please find attached an image - hope this will better illustrate what I was trying to convey. If the subplot in the image stops "scrolling" or rolling when it's boundaries are reached, it would be nice.

Ah, I think understand what you're looking for now. You want the pylab toolbar to stop panning when you reach the end of the data range instead of continuing over into an empty area. Does that sound right to you?

I was trying to find if the whole subplot could be enclosed within a scrollbar, JDH says that is not possible.

I believe you may have been asking the wrong question. :wink:

Based on my understanding of things it should be possible to add this feature to the toolbar, assuming one can easily determine the bounding box of the plot in axes coordinates. One of the devs might be able to implement it for you, although I obviously cannot speak for them.

Ken

···

On Mar 29, 2007, at 2:49 PM, Iyer wrote: