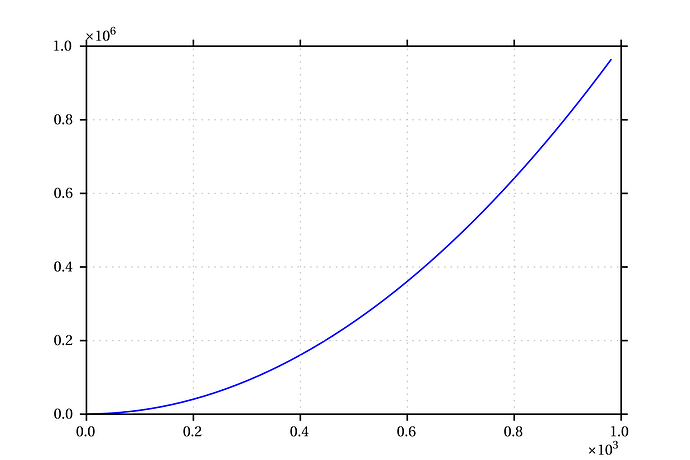
Hi there:
I tried to plot large numbers and scientific notation has to be used.
But instead of "\times" symbol, it used "e", which cannot be accepted as
publishable. Anyone know how to deal with that?
My original code is:
···
####################################################
import matplotlib.pyplot as plt
import numpy as np
from matplotlib.ticker import ScalarFormatter
# data generation
x = np.arange(1,1e3,20)
y = x**2
formatter = ScalarFormatter()
formatter.set_scientific(True)
formatter.set_powerlimits((-3,3))
fig = plt.figure()
ax = fig.add_subplot(111)
ax.xaxis.set_major_formatter(formatter)
ax.yaxis.set_major_formatter(formatter)
ax.plot(x,y)
plt.show()
####################################################
Hao,
I ran your code and got this (see attached). I don't get the 'e' that you mention, but a 'times' symbol instead.
My rcParams are such that the entire figure is sent to LaTeX. Not sure if that changes things.
Good luck
-Paul
···
-----Original Message-----
From: Hao Wen [mailto:wenhao.student@…287…]
Sent: Monday, December 07, 2009 7:25 PM
To: matplotlib-users@lists.sourceforge.net
Subject: [Matplotlib-users] scientific notation \times symbol
Hi there:
I tried to plot large numbers and scientific notation has to be used.
But instead of "\times" symbol, it used "e", which cannot be accepted as
publishable. Anyone know how to deal with that?
My original code is:
####################################################
import matplotlib.pyplot as plt
import numpy as np
from matplotlib.ticker import ScalarFormatter
# data generation
x = np.arange(1,1e3,20)
y = x**2
formatter = ScalarFormatter()
formatter.set_scientific(True)
formatter.set_powerlimits((-3,3))
fig = plt.figure()
ax = fig.add_subplot(111)
ax.xaxis.set_major_formatter(formatter)
ax.yaxis.set_major_formatter(formatter)
ax.plot(x,y)
plt.show()
####################################################
Hao Wen wrote:
Hi there:
I tried to plot large numbers and scientific notation has to be used.
But instead of "\times" symbol, it used "e", which cannot be accepted as
publishable. Anyone know how to deal with that?
Add a kwarg to your formatter initialization. See below.
Eric
My original code is:
####################################################
import matplotlib.pyplot as plt
import numpy as np
from matplotlib.ticker import ScalarFormatter
# data generation
x = np.arange(1,1e3,20)
y = x**2
formatter = ScalarFormatter()
formatter = ScalarFormatter(useMathText=True)
···
formatter.set_scientific(True)
formatter.set_powerlimits((-3,3))
fig = plt.figure()
ax = fig.add_subplot(111)
ax.xaxis.set_major_formatter(formatter)
ax.yaxis.set_major_formatter(formatter)
ax.plot(x,y)
plt.show()
####################################################
