Scienctific notation in log scale

Excuse me,everyone!
Recently I ran into a problem when I used matplotlib.As you see,I used loglog aspect in my items.The xaxis scale numble is scientific notation,but I do not need to it.I want the xaxis data to be displayed as integers like 1, 10.So do you have some ways to hide the scientific notation display in xaxis?
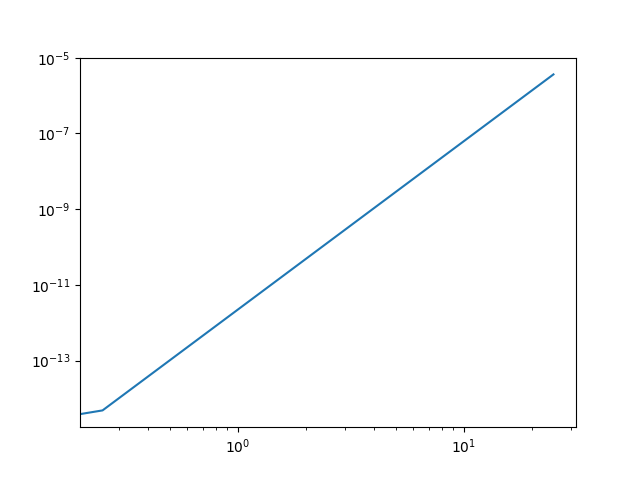
Here are my code and plot.

import numpy as np
import matplotlib.pyplot as plt

x=np.linspace(0,25,100)
y=2.20518E-12*x**4.44646

plt.plot(x,y)
plt.xscale(‘log’)
plt.yscale(‘log’)
plt.show()

image

python - Matplotlib log scale tick label number formatting - Stack Overflow Has two very good answers to this.

from matplotlib.ticker import ScalarFormatter
ax = plt.gca()
for axis in [ax.xaxis, ax.yaxis]:
    axis.set_major_formatter(ScalarFormatter())

For a complete reference to how to control the tick location and formatting see matplotlib.ticker — Matplotlib 3.5.1 documentation and Tick formatters — Matplotlib 3.5.1 documentation for a very nice visualization of the available formatters.