This is mainly a question for JJ. I would like to make a schematic
diagram, like you might get from Dia or OmniGraffle. With the offset
boxes, annotations, vpackers/hpackers and fancy arrows, it seems like
the pieces are mostly in place. Unlike simple annotations, I need to
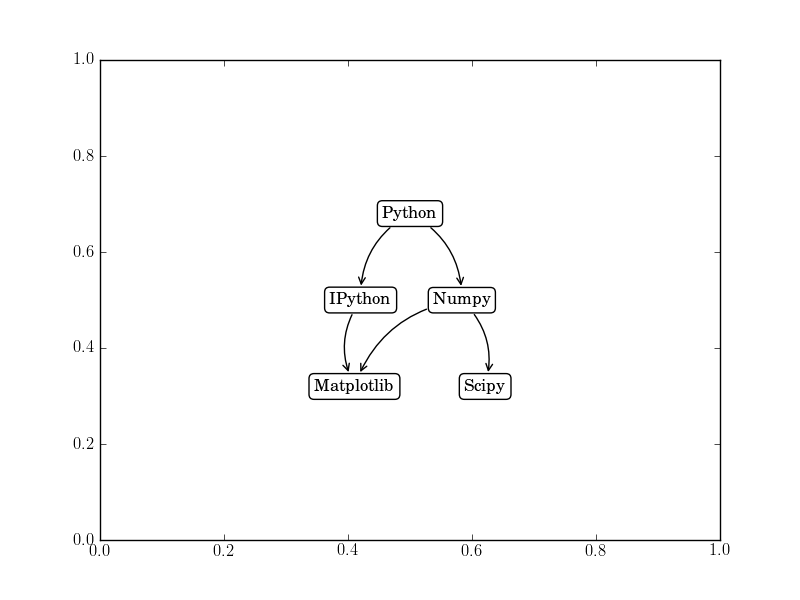
have multiple arrows originating from a single box. The diagram I am
trying to draw shows the relationship between various packages for
scientific computing in python. The crude ASCII art picture looks
like this:
Python
/ \
/ \
IPython Numpy
> / \
> / \
matplotlib scipy
where arrows are pointing from
Python -> IPython
Python -> numpy
IPython -> matplotlib
numpy -> matplotlib
numpy -> scipy
and IPython and numpy are on one level (HPacker?) and are below Python
(Vpacker?) and so on. Each text instance is surrounded by a fancy box
and are connected by fancy arrows.
Is it fairly easy to put something like this together using all the
offsetbox tools and fancy arrows?
Thanks,
JDH