I've been trying to set the font properties of the plots that I've
been making with matplotlib; however, there appears to be a problem
with font rendering. For example, when I check the properties of text
on the axes, etc, the font class is set to serif; however, the font in
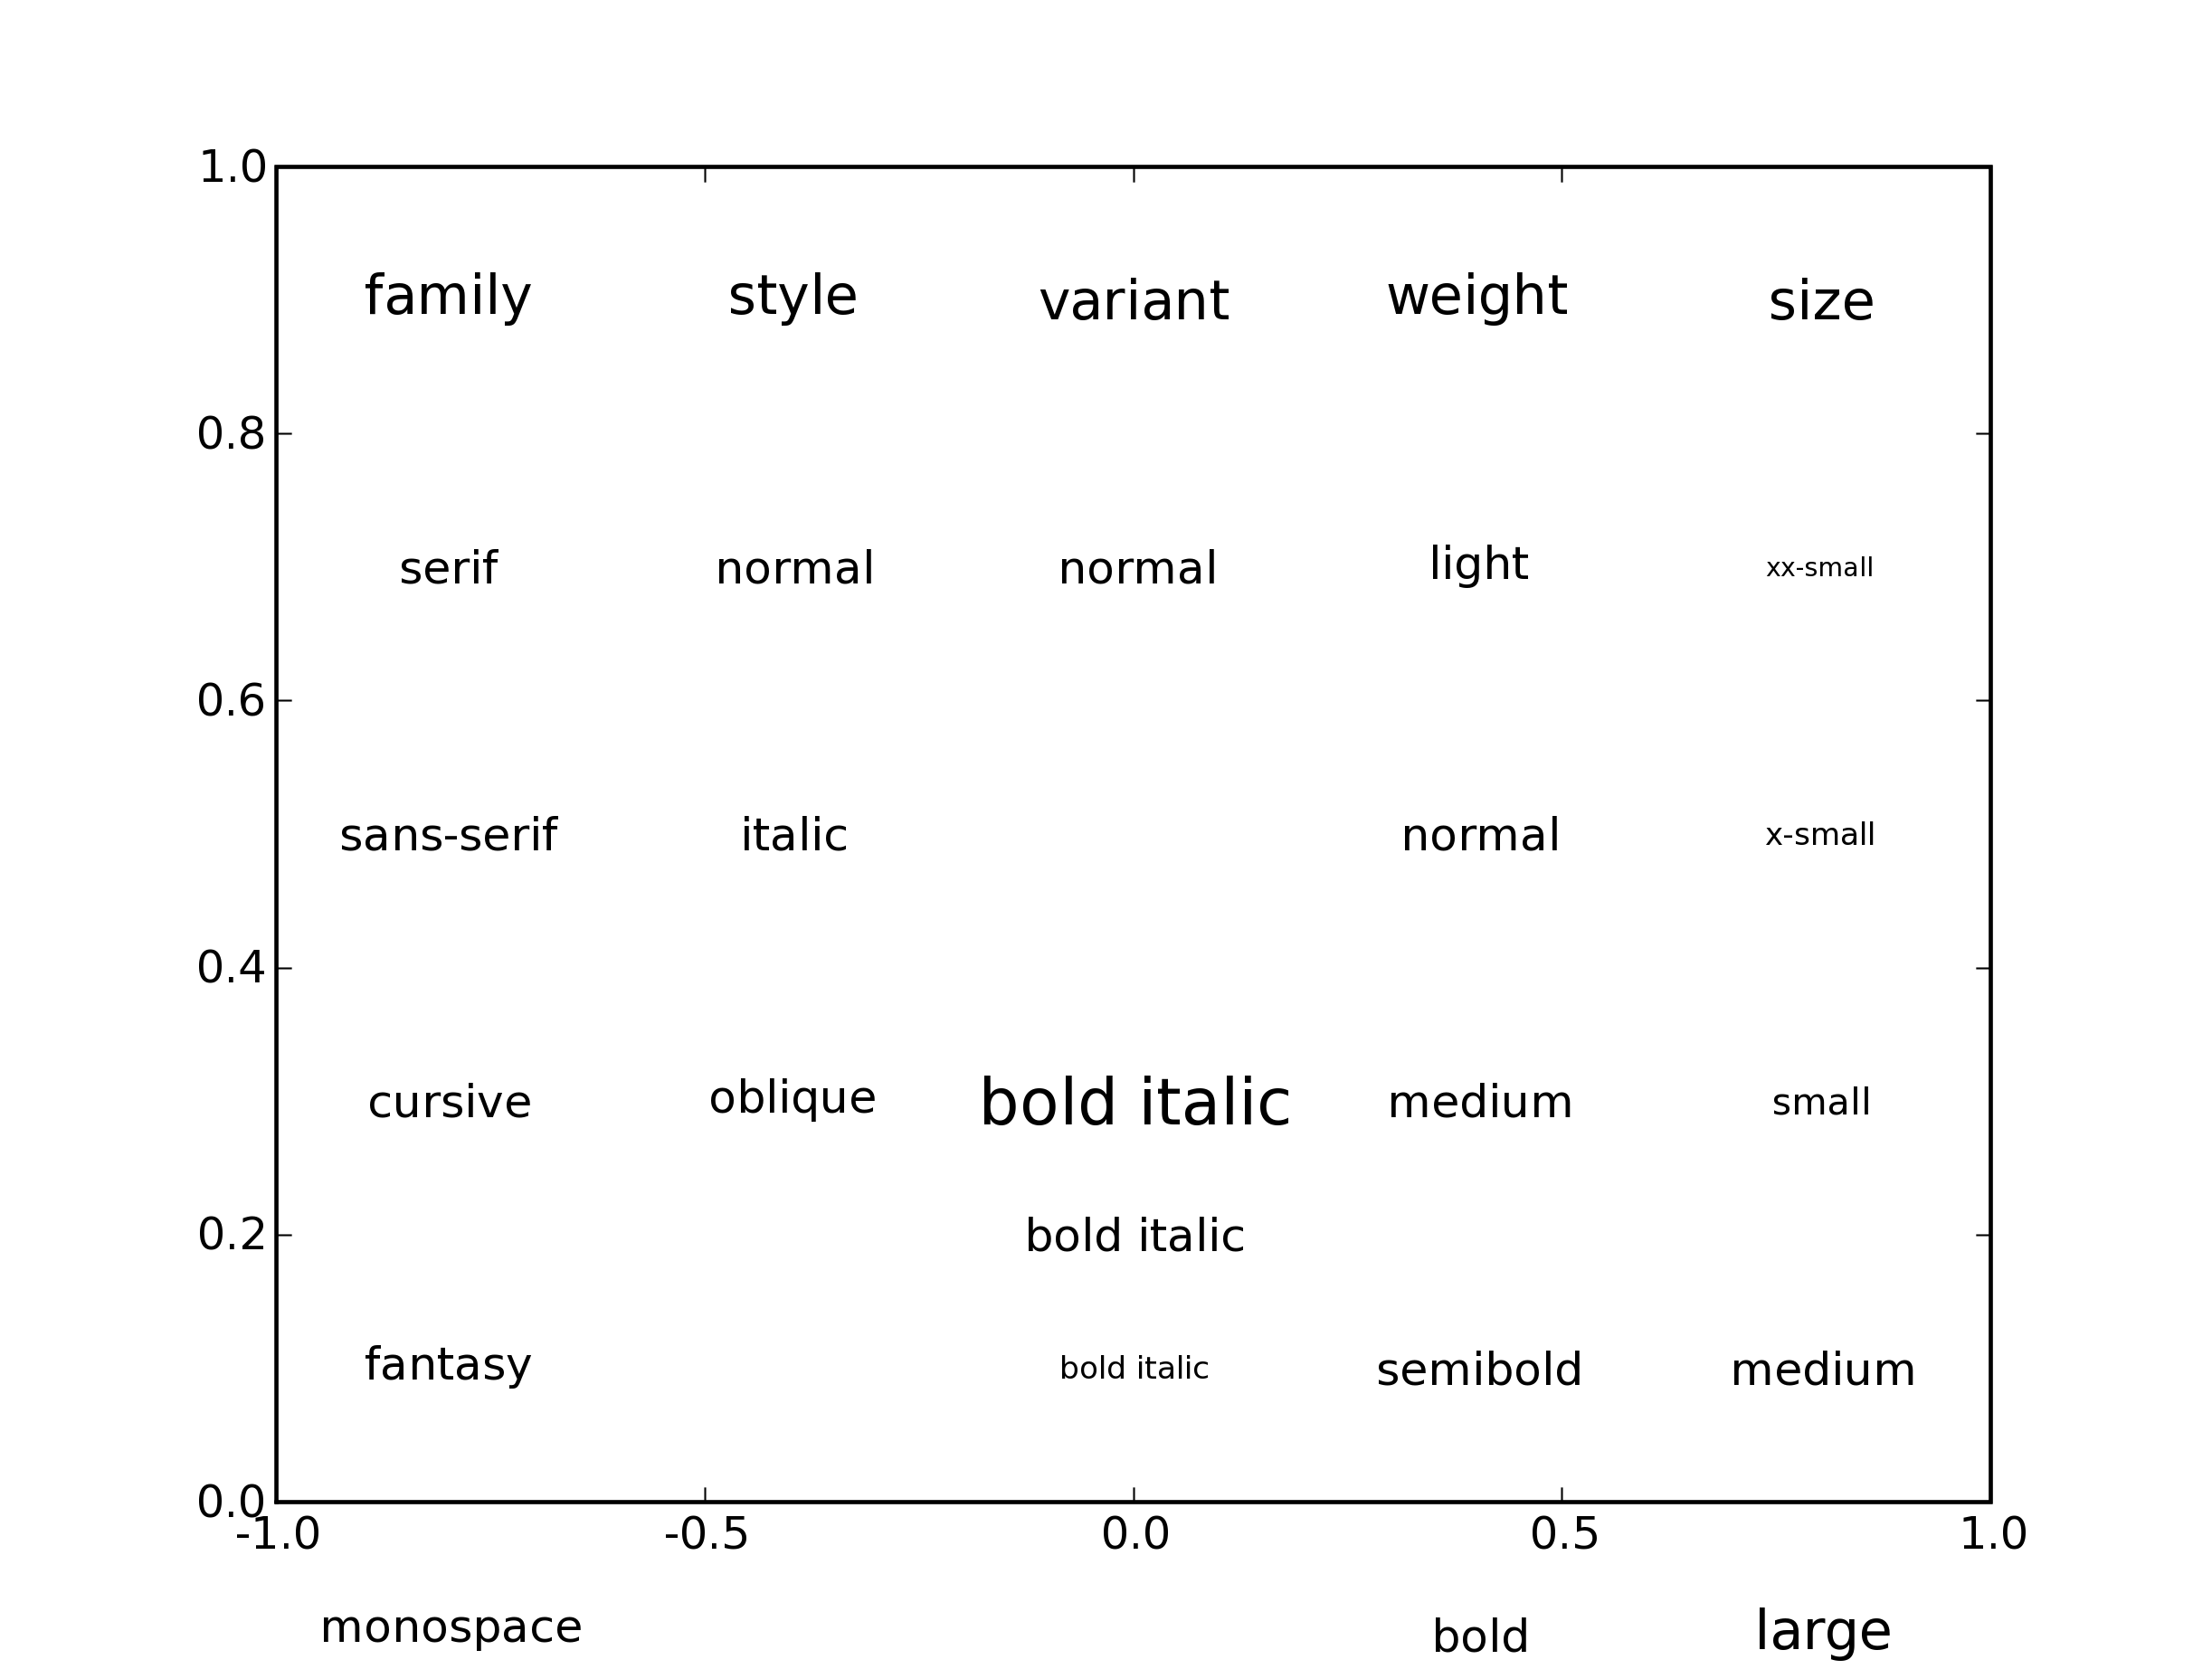
the plot does not appear to be serif. I ran several of the font demos
in the matplotlib examples directory, and the fonts all looked the
same (except for size). Attached is the PNG of the fonts_demo.py
output.
The only way I was able to get serif fonts was if I call:
rc('text', usetex=True), and even then this only changes the fonts on
the axis tick labels. xlabel, ylabel still remain sans-serif.
I'm sure I am missing something obvious, but have read through all the
documentation available on the matplotlib website regarding fonts, and
they don't seem to indicate that I need to install anything else.
I'm not able to reproduce this bug here (on a Linux machine).
Which backend are you using? What version of matplotlib? Can you set the parameter "verbose.level" to "debug-annoying" and send the output to this list?
Cheers,
Mike
Orest Kozyar wrote:
···
I've been trying to set the font properties of the plots that I've
been making with matplotlib; however, there appears to be a problem
with font rendering. For example, when I check the properties of text
on the axes, etc, the font class is set to serif; however, the font in
the plot does not appear to be serif. I ran several of the font demos
in the matplotlib examples directory, and the fonts all looked the
same (except for size). Attached is the PNG of the fonts_demo.py
output.
The only way I was able to get serif fonts was if I call:
rc('text', usetex=True), and even then this only changes the fonts on
the axis tick labels. xlabel, ylabel still remain sans-serif.
I'm sure I am missing something obvious, but have read through all the
documentation available on the matplotlib website regarding fonts, and
they don't seem to indicate that I need to install anything else.
-------------------------------------------------------------------------
SF.Net email is sponsored by:
Check out the new SourceForge.net Marketplace.
It's the best place to buy or sell services
for just about anything Open Source. http://ad.doubleclick.net/clk;164216239;13503038;w?http://sf.net/marketplace
It's matplotlib 0.90.1.0003, and it does not seem to matter which
backend I am using. All backends available on my machine give me a
sans-serif font, with the exception of WX, which gives me a serif
font. I've attached the debug output to this email. It looks like
findfont is failing to find the requested serif fonts so it is
returning the default font. I'm not sure why this would be the case
as I know I have Times New Roman (times.ttf) in my c:\windows\fonts
folder.
I looked through the matplotlib docs and it says that findfont should
be able to find the fonts if they are in system default locations, so
I'm a bit stumped as to what to do now.
On Dec 14, 2007 8:16 AM, Michael Droettboom <[email protected]...> wrote:
I'm not able to reproduce this bug here (on a Linux machine).
Which backend are you using? What version of matplotlib? Can you set
the parameter "verbose.level" to "debug-annoying" and send the output to
this list?
Cheers,
Mike
Orest Kozyar wrote:
> I've been trying to set the font properties of the plots that I've
> been making with matplotlib; however, there appears to be a problem
> with font rendering. For example, when I check the properties of text
> on the axes, etc, the font class is set to serif; however, the font in
> the plot does not appear to be serif. I ran several of the font demos
> in the matplotlib examples directory, and the fonts all looked the
> same (except for size). Attached is the PNG of the fonts_demo.py
> output.
>
> The only way I was able to get serif fonts was if I call:
>
> rc('text', usetex=True), and even then this only changes the fonts on
> the axis tick labels. xlabel, ylabel still remain sans-serif.
>
> I'm sure I am missing something obvious, but have read through all the
> documentation available on the matplotlib website regarding fonts, and
> they don't seem to indicate that I need to install anything else.
>
> This is Python 2.5 on Windows XP.
>
> Thanks,
> Orest
>
>
> ------------------------------------------------------------------------
>
>
> ------------------------------------------------------------------------
>
> -------------------------------------------------------------------------
> SF.Net email is sponsored by:
> Check out the new SourceForge.net Marketplace.
> It's the best place to buy or sell services
> for just about anything Open Source.
> http://ad.doubleclick.net/clk;164216239;13503038;w?http://sf.net/marketplace
>
>
> ------------------------------------------------------------------------
>
> _______________________________________________
> Matplotlib-users mailing list
> [email protected]
> matplotlib-users List Signup and Options
--
Michael Droettboom
Science Software Branch
Operations and Engineering Division
Space Telescope Science Institute
Operated by AURA for NASA
0.90 had a number of issues where it was way too strict in what it would consider a font match -- so it may be that it is rejecting Times New Roman because the numerical weight isn't an exact match, or something like that.
In any case, it should be able to match against the serif font included in matplotlib -- that's still a bit of a puzzle.
You can try removing your font cache file (which will force it to regenerate), which in Windows (I believe) is in c:\Documents and Settings\<user>\.matplotlib\ttffont.cache . If that doesn't work, can you send me that file (off-list) -- then I can see what fonts it thinks you have.
Cheers,
Mike
Orest Kozyar wrote:
···
Hi Mike,
It's matplotlib 0.90.1.0003, and it does not seem to matter which
backend I am using. All backends available on my machine give me a
sans-serif font, with the exception of WX, which gives me a serif
font. I've attached the debug output to this email. It looks like
findfont is failing to find the requested serif fonts so it is
returning the default font. I'm not sure why this would be the case
as I know I have Times New Roman (times.ttf) in my c:\windows\fonts
folder.
I looked through the matplotlib docs and it says that findfont should
be able to find the fonts if they are in system default locations, so
I'm a bit stumped as to what to do now.
Thanks!
Orest
On Dec 14, 2007 8:16 AM, Michael Droettboom <[email protected]...> wrote:
I'm not able to reproduce this bug here (on a Linux machine).
Which backend are you using? What version of matplotlib? Can you set
the parameter "verbose.level" to "debug-annoying" and send the output to
this list?
Cheers,
Mike
Orest Kozyar wrote:
I've been trying to set the font properties of the plots that I've
been making with matplotlib; however, there appears to be a problem
with font rendering. For example, when I check the properties of text
on the axes, etc, the font class is set to serif; however, the font in
the plot does not appear to be serif. I ran several of the font demos
in the matplotlib examples directory, and the fonts all looked the
same (except for size). Attached is the PNG of the fonts_demo.py
output.
The only way I was able to get serif fonts was if I call:
rc('text', usetex=True), and even then this only changes the fonts on
the axis tick labels. xlabel, ylabel still remain sans-serif.
I'm sure I am missing something obvious, but have read through all the
documentation available on the matplotlib website regarding fonts, and
they don't seem to indicate that I need to install anything else.
-------------------------------------------------------------------------
SF.Net email is sponsored by:
Check out the new SourceForge.net Marketplace.
It's the best place to buy or sell services
for just about anything Open Source. http://ad.doubleclick.net/clk;164216239;13503038;w?http://sf.net/marketplace
Not sure if this is your issue but I had problems with fonts until I uncommented the RC file in the fonts section of it. Matplotlib ships with the RC commented out. The file matplotlibrc is found in the matplotlib\mpl-data folder. You can just edit it with Notepad and uncomment the lines regarding fonts and try it again.
···
On Dec 13, 2007 4:01 PM, Orest Kozyar <orest.kozyar@…287…> wrote:
I’ve been trying to set the font properties of the plots that I’ve
been making with matplotlib; however, there appears to be a problem
with font rendering. For example, when I check the properties of text
on the axes, etc, the font class is set to serif; however, the font in
the plot does not appear to be serif. I ran several of the font demos
in the matplotlib examples directory, and the fonts all looked the
same (except for size). Attached is the PNG of the fonts_demo.py
output.
The only way I was able to get serif fonts was if I call:
rc(‘text’, usetex=True), and even then this only changes the fonts on
the axis tick labels. xlabel, ylabel still remain sans-serif.
I’m sure I am missing something obvious, but have read through all the
documentation available on the matplotlib website regarding fonts, and
they don’t seem to indicate that I need to install anything else.
Not sure if this is your issue but I had problems with fonts until I
uncommented the RC file in the fonts section of it. Matplotlib ships with
the RC commented out. The file matplotlibrc is found in the
matplotlib\mpl-data folder. You can just edit it with Notepad and uncomment
the lines regarding fonts and try it again.
In the interest of fixing this bug for others, I wonder if you wouldn't mind testing something for me (since I don't have Windows handy, and even if I did, it wouldn't be *your* Windows environment...)
The only different between the provided matplotlibrc and the built-in defaults seems to be font.weight. In the matplotlibrc it is "medium", and in the defaults it is "normal". If you uncomment only "font.weight", and leave the others commented out, do things work for you?
Cheers,
Mike
Orest Kozyar wrote:
···
Not sure if this is your issue but I had problems with fonts until I
uncommented the RC file in the fonts section of it. Matplotlib ships with
the RC commented out. The file matplotlibrc is found in the
matplotlib\mpl-data folder. You can just edit it with Notepad and uncomment
the lines regarding fonts and try it again.