Unfortunately z-sorting the polygons is a really hard problem. Or in fact, in the way it is currently implemented, an unsolvable problem.
Please remember that mplot3d is not a full-blown 3d engine. Fixing this would require either a z-buffer or things such as BSP trees, which I do not think are feasible to implement.
However, I do believe that there might be a small bug lurking somewhere or some other slight improvements to be made. I'll try to look into it after my 2 week holiday.
I am also seeing this behavior and it is unfortunately holding my
project back.
I have seen it with python 2.6 on Debian Linux and Windows XP. I have
seen it in version 0.99.1 and the latest SVN tree (as of yesterday).
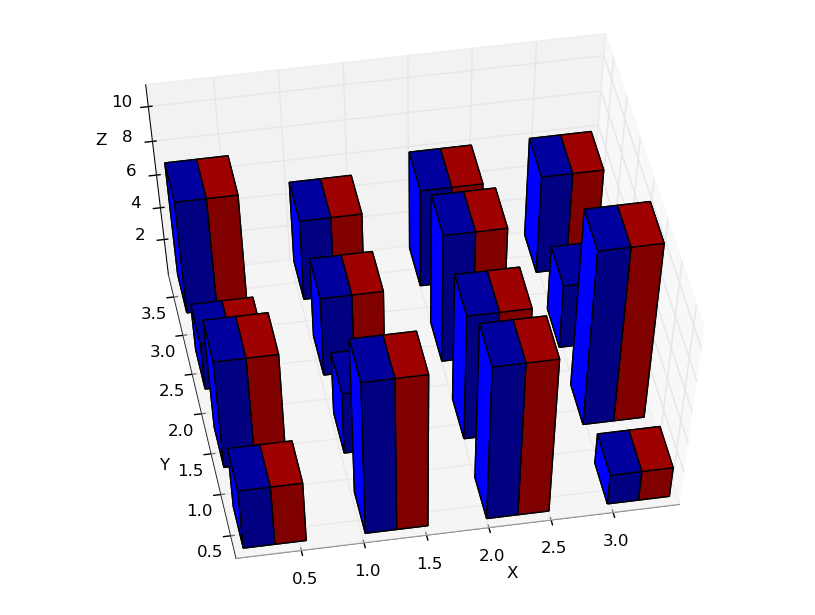
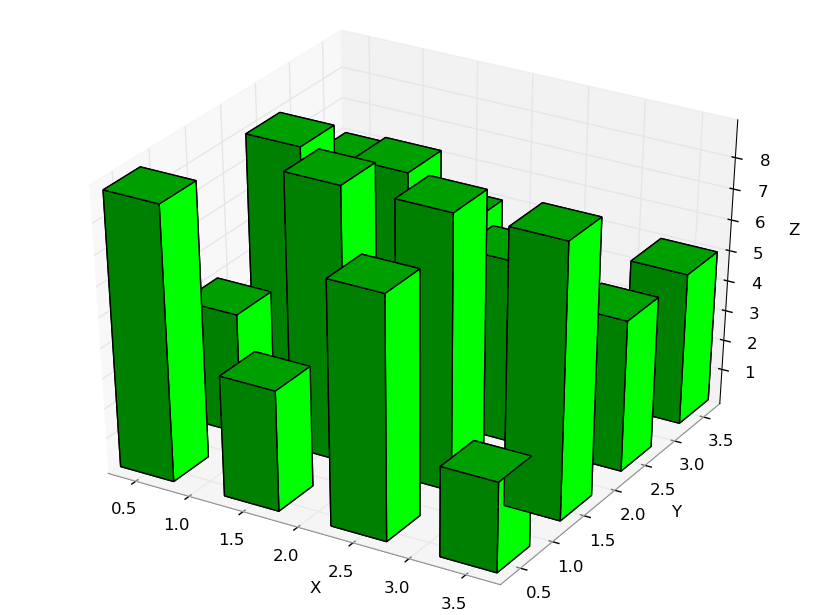
I want to highlight a portion of each 3d bar with another color. This
image shows what I want to do:
http://old.nabble.com/file/p27358778/bar3d-1.png
(http://www.benaxelrod.com/temp/bar3d-1.png)
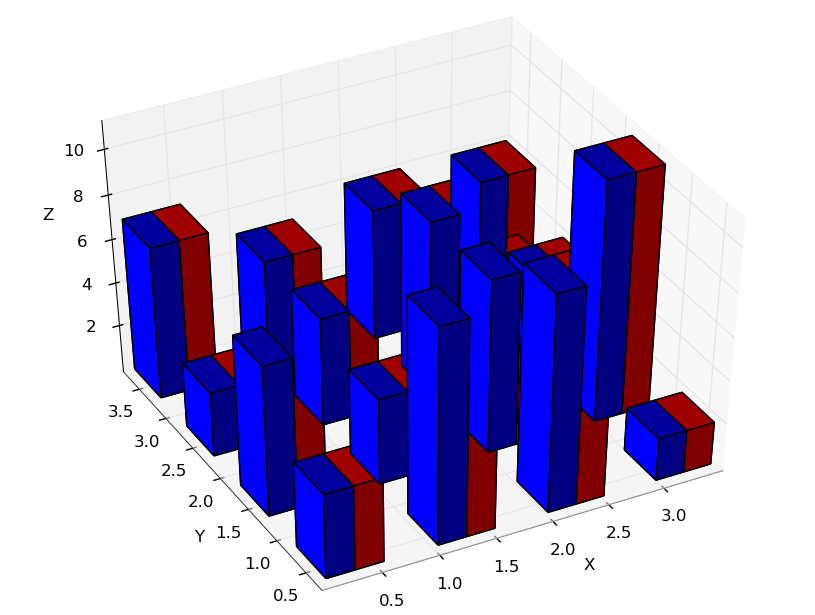
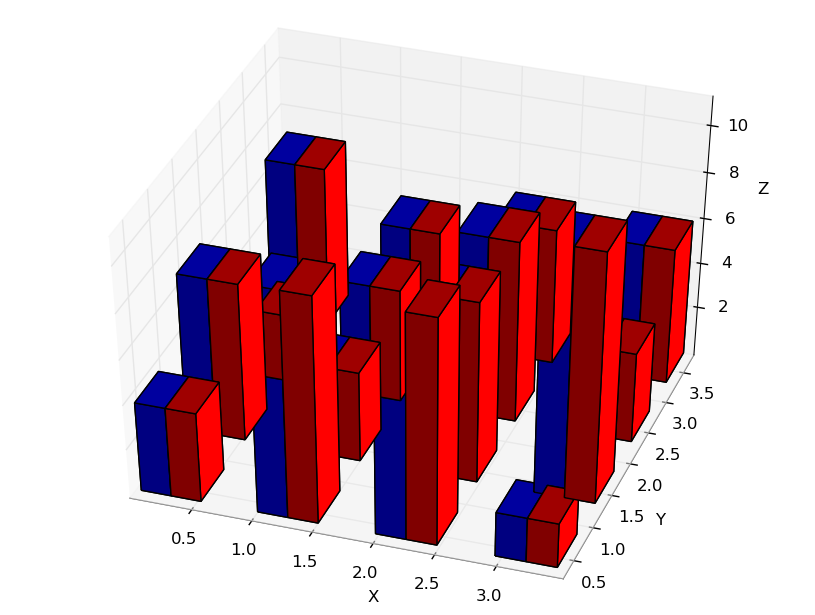
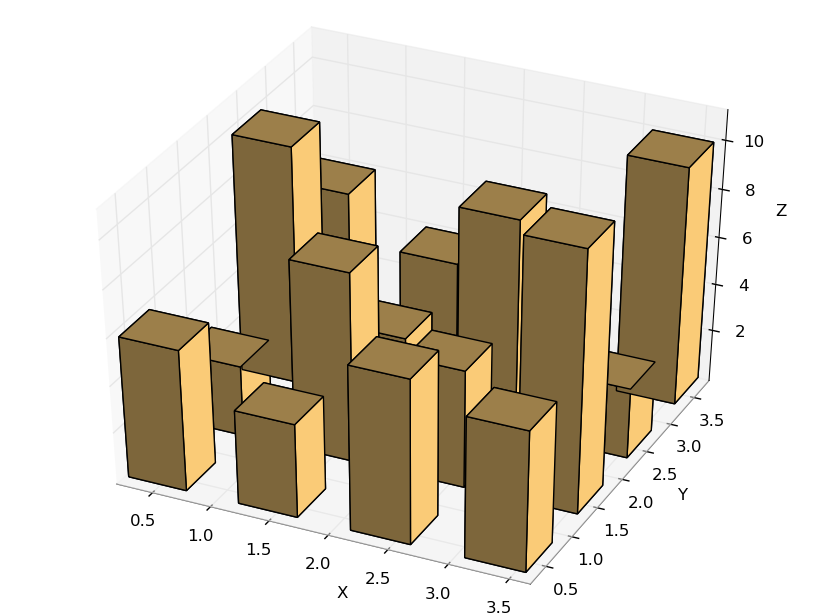
But rotating the view leads to rendering issues:
http://old.nabble.com/file/p27358778/bar3d-2.png
(http://www.benaxelrod.com/temp/bar3d-2.png)
http://old.nabble.com/file/p27358778/bar3d-3.png
(http://www.benaxelrod.com/temp/bar3d-3.png)
In this example, the bars are drawn next to each other. Here is the
source code to generate the images:
# code adapted from: hist3d_demo.py
from mpl_toolkits.mplot3d import Axes3D import matplotlib.pyplot as
plt import numpy as np
fig = plt.figure()
ax = Axes3D(fig)
x, y = np.random.rand(2, 100) * 4
hist, xedges, yedges = np.histogram2d(x, y, bins=4)
elements = (len(xedges) - 1) * (len(yedges) - 1) xpos, ypos =
np.meshgrid(xedges[:-1]+0.25, yedges[:-1]+0.25)
xpos = xpos.flatten()
ypos = ypos.flatten()
zpos = np.zeros(elements)
dx = 0.5 * np.ones_like(zpos)
dy = dx.copy()
dz = hist.flatten()
dx = dx*0.5
xpos = xpos - dx
ax.bar3d(xpos, ypos, zpos, dx, dy, dz, color='b') ax.bar3d(xpos+dx,
ypos, zpos, dx, dy, dz, color='r')
ax.set_xlabel('X')
ax.set_ylabel('Y')
ax.set_zlabel('Z')
plt.show()
#end code
I also tried to overlap the bars, but the result was even worse
because from certain angles one of the colors was not visible at all.
I thought that the issue might be due to calling bar3d muliple times.
So I tried passing in an array of collors to bar3d with no luck. It
seems that bar3d only takes a single color. Is this planned to be
fixed so that
bar3d() can take a color array just like bar()?
Also note that even very simple examples demonstrate the bug. For example:
http://old.nabble.com/file/p27358778/bar3d-4.png
(http://www.benaxelrod.com/temp/bar3d-4.png)
http://old.nabble.com/file/p27358778/bar3d-5.png
(http://www.benaxelrod.com/temp/bar3d-5.png)
Thanks,
-Ben
pierre-yves.debrito wrote:
Hi,
I am currently using this version : matplotlib-0.99.1.win32-py2.6.exe
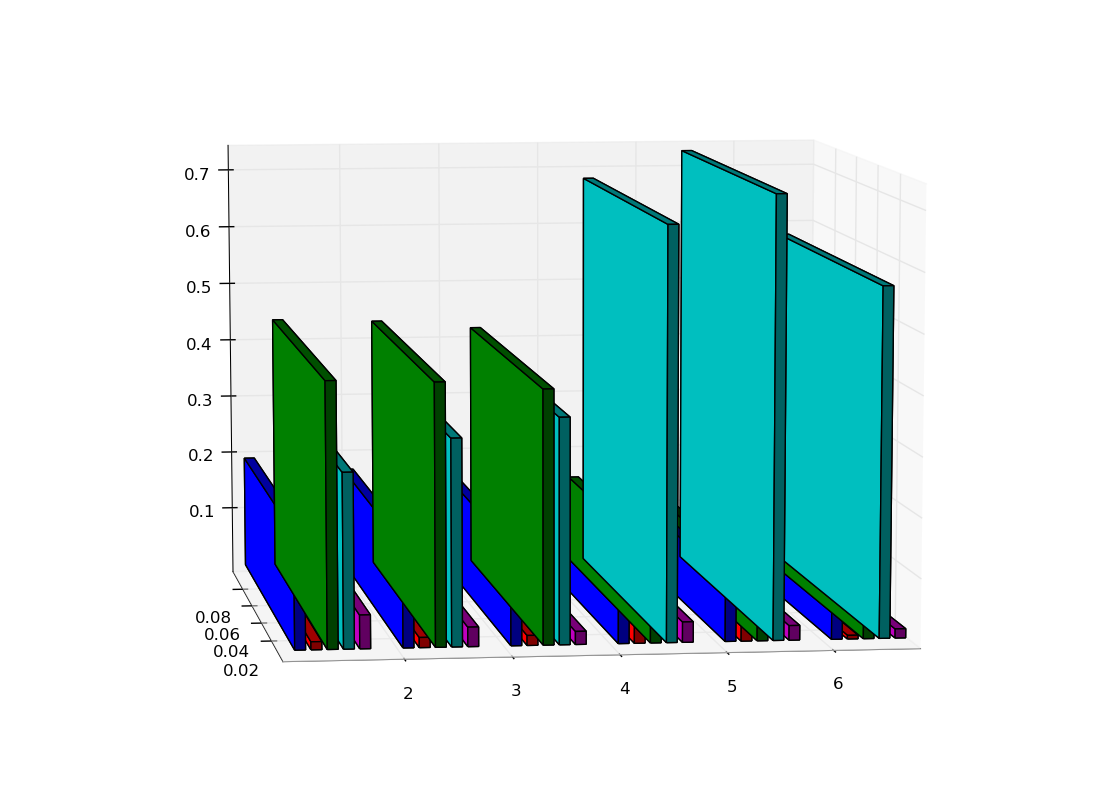
When I draw several Axes3D.bar3d in the same figure, as in this
example, the faces are not drawn in the correct order.
Did I do something wrong or is it a rendering bug?
Is there a workaround?
Thanks
Pierre-Yves de Brito
from mpl_toolkits.mplot3d import Axes3D import matplotlib.pyplot as
plt from numpy import array, arange
contrib=[[0.18263,0.19098,0.16815,0.16295,0.09372,0.10505,0.15934],
[0.00769,0.01315,0.01668,0.01645,0.03536,0.03493,0.00599],
[0.47109,0.43646,0.43171,0.41794,0.14761,0.09472,0.21969],
[0.25633,0.28820,0.34066,0.37184,0.68048,0.72773,0.57749],
[0.06492,0.05539,0.03205,0.02151,0.03357,0.02411,0.01512]]
print contrib[0]
N = 7
ind = arange(N) # the x locations for the groups width = 0.1
# the width of the bars: can also be len(x) sequence
I = array([1,1,1,1,1,1,1])
fig = plt.figure()
ax = Axes3D(fig)
for i in range(1,7):
ax.bar3d(ind[i], 0, 0, 0.1, 0.1, contrib[0][i], color='b')
ax.bar3d(array(ind[i])+0.15, 0, 0, 0.1, 0.1, contrib[1][i], color='r'
)
ax.bar3d(array(ind[i])+2*0.15, 0, 0, 0.1, 0.1, contrib[2][i],
color=
'g')
ax.bar3d(array(ind[i])+3*0.15, 0, 0, 0.1, 0.1, contrib[3][i],
color=
'c')
ax.bar3d(array(ind[i])+4*0.15, 0, 0, 0.1, 0.1, contrib[4][i],
color=
'm')
plt.show()
This message and any attachments (the "message") is intended solely
for the addressees and is confidential.
If you receive this message in error, please delete it and
immediately notify the sender. Any use not in accord with its
purpose, any dissemination or disclosure, either whole or partial, is
prohibited except formal approval. The internet can not guarantee the
integrity of this message.
BNP PARIBAS (and its subsidiaries) shall (will) not therefore be
liable for the message if modified.
Do not print this message unless it is necessary, consider the
environment.
\-\-\-\-\-\-\-\-\-\-\-\-\-\-\-\-\-\-\-\-\-\-\-\-\-\-\-\-\-\-\-\-\-\-\-\-\-\-\-\-\-\-\-\-\-
Ce message et toutes les pieces jointes (ci-apres le
"message") sont etablis a l'intention exclusive de ses destinataires
et sont confidentiels. Si vous recevez ce message par erreur, merci
de le detruire et d'en avertir immediatement l'expediteur. Toute
utilisation de ce message non conforme a sa destination, toute
diffusion ou toute publication, totale ou partielle, est interdite,
sauf autorisation expresse. L'internet ne permettant pas d'assurer
l'integrite de ce message, BNP PARIBAS (et ses
filiales) decline(nt) toute responsabilite au titre de ce message,
dans l'hypothese ou il aurait ete modifie.
N'imprimez ce message que si necessaire, pensez a l'environnement.
---------------------------------------------------------------------
--------- Let Crystal Reports handle the reporting - Free Crystal
Reports 2008 30-Day trial. Simplify your report design, integration
and deployment - and focus on what you do best, core application
coding. Discover what's new with Crystal Reports now.
http://p.sf.net/sfu/bobj-july
_______________________________________________
Matplotlib-users mailing list
[email protected]
matplotlib-users List Signup and Options
--
View this message in context:
http://old.nabble.com/rendering-bug-in-bar3d-tp26413625p27358778.html
Sent from the matplotlib - users mailing list archive at Nabble.com.
----------------------------------------------------------------------
-------- The Planet: dedicated and managed hosting, cloud storage,
colocation Stay online with enterprise data centers and the best
network in the business Choose flexible plans and management services
without long-term contracts Personal 24x7 support from experience
hosting pros just a phone call away.
http://p.sf.net/sfu/theplanet-com
_______________________________________________
Matplotlib-users mailing list
[email protected]
matplotlib-users List Signup and Options
