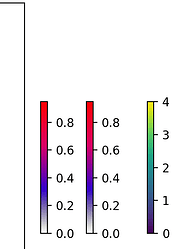
I am creating fig with 2 subplots as below:
from matplotlib import pyplot as plt
import matplotlib as mtl
mtl.use('TkAgg')

fig, ax = plt.subplots(1, 2, figsize=(6, 18), dpi=200)
axes = ax.ravel()
axes[0].imshow(plateLabeled)
pcm = axes[0].pcolormesh(plateLabeled)#, cmap='msml2')
fig.colorbar(pcm, ax=axes[0], shrink=0.4, pad=0.1)
initially the first subplot has an image shown, then I click inside and then the second subplot display a graph. Then I am trying to change/update the first subplot based on some event(mouse click) in the second subplot. It works nicely except the colorbar is not updating with the update or removal of the previous contents in the first subplot.
def onclick(event):
    global pcm
    if event.button == 1 and event.inaxes == axes[0]:  # 'MouseButton.LEFT':
        xdata_, ydata_ = round(event.xdata), round(event.ydata)
        mz_, int_ = xvector, yvector
        spec, = axes[1].plot(mz_, int_, lw=0.5, alpha=0.5)
        axes[1].set_title("Plot window")
        axes[0].scatter(xdata_, ydata_, marker='.', c=spec.get_color(), edgecolors=spec.get_color(), s=1)
            # axes[0].text(xdata_, ydata_, (xdata_, ydata_))
    if event.button == 3 and event.dblclick and event.inaxes == axes[1]:
        # print("right button + double click + plot 2")
        axes[1].clear()
        for scatter in axes[0].collections:
            scatter.remove()
    if event.button == 1 and event.dblclick and event.inaxes == axes[1]: # doubleclick spectra window
        mz_value = event.xdata
        ymax_ = event.ydata
        tol_ = 10
        im = np.zeros(
            (dict['max count of pixels x'] + 1,
             dict['max count of pixels y'] + 1)
        )
        for i, (x, y, z_) in enumerate(coordinates):
            reduce_func = sum
            if z_ == 0:
                UserWarning("z coordinate = 0 present, if you're getting blank images ")
            if z_ == 1:
                #  codes that simply create an
                #  image to display in axes[0]
                im[x, y] = reduce_func(ints[min_i:max_i + 1])  # y - 1, x - 1
        axes[1].axvspan(xmin=mz_value-tol_, xmax=mz_value+tol_, ymin=0, ymax=0.7, facecolor='g', alpha=0.3, zorder=2)
        axes[0].clear()
        # if axes[0].cb:
        #     axes[0].figure.delaxes(axes[0].figure.axes[1])
        # fig.delaxes(axes[0][1])
        # fig.colorbar(pcm, ax=axes[0]).clear()
        # fig.colorbar(pcm, ax=axes[0]).set_ticks([])
        # fig.clear()
        axes[0].imshow(im, cmap='msml2')
        axes[0].set_title("m/z: {:.4f}, tol: {}".format(mz_value, tol_))
        pcm = axes[0].pcolormesh(im, cmap='msml2')
        # fig.delaxes(axes[0])
        fig.colorbar(pcm, ax=axes[0], shrink=0.4, pad=0.1)
    plt.pause(0.1)
cid = fig.canvas.mpl_connect('button_press_event', onclick)
plt.show()
See the result below:
even axes[0] updates but the colobars from previous imshow remains…
How do I remove the colorbars following the codes above.
