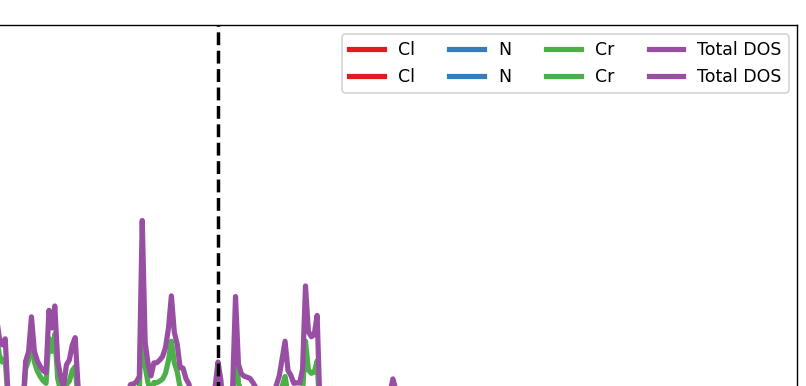
Hii users
I have a script attached below. Here plt is a matplotlib Axes object. I want to change legend horizontally for that i
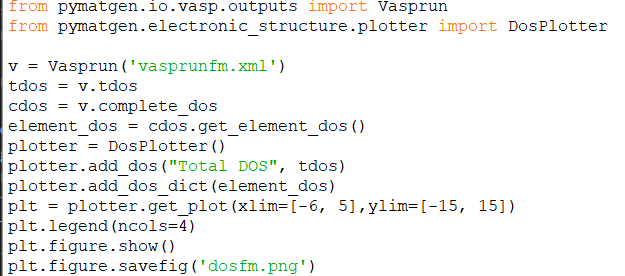
use ncols but now i am getting two legends in my plot. Anyone please help me what am i doing wrong.
You’d probably want to call set_ncols
https://matplotlib.org/stable/api/legend_api.html#matplotlib.legend.Legend.set_ncols
on the existing legend object, and not add a new one.