Part of my python file reads
Plot X,Y,Z
fig, ax = plt.subplots()
ax.set_title(‘Day: 175 Hour: 24’);
cset1 = ax.contour(X, Y, Z, levels=100)
norm= mpl.colors.Normalize(vmin=cset1.cvalues.min(), vmax=cset1.cvalues.max())
sm = plt.cm.ScalarMappable(norm=norm, cmap = cset1.cmap)
sm.set_array()
fig.colorbar(sm, ticks=cset1.levels, label=‘signal fft - log(mag)’)
ax.set_xlabel(‘Seconds’)
ax.set_ylabel(‘Frequency hz’)
plt.yticks([0,328,655,983,1311,1639,1966,2294,2622,2949,3277,3605,3932],[0,5,10,15,20,25,30,35,40,45,50,55,60])
fig.savefig(‘test.png’, dpi=300)
plt.show()
print(‘test.png’)
quit()
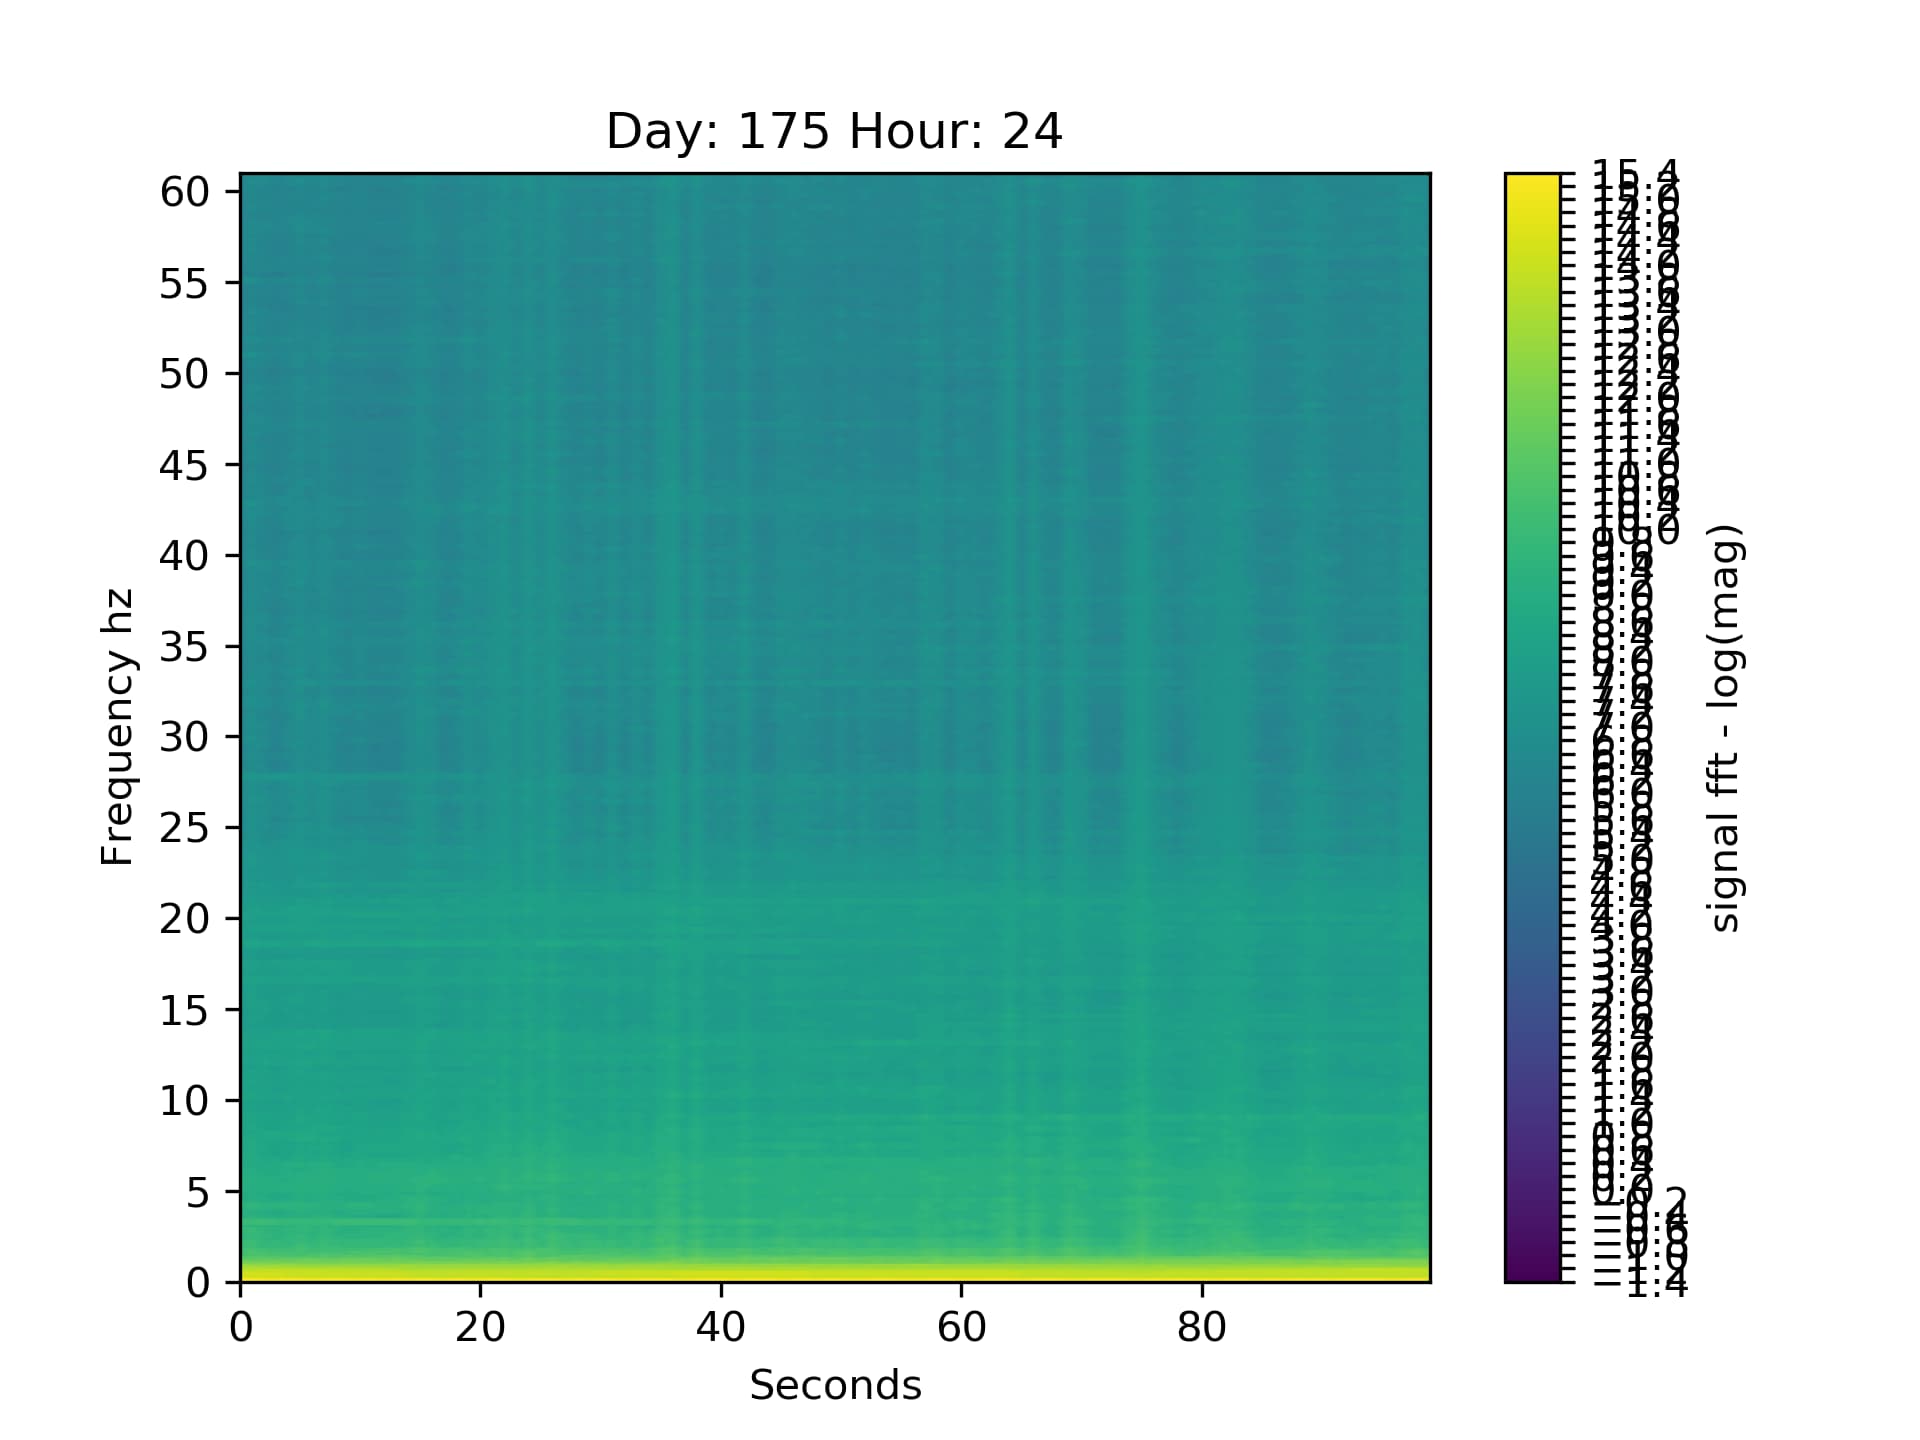
But the colorbar tics is overloaded, as is obvious.
How can the code be fixed so the tics are easy to read, say intervals of 1 or 2 ?