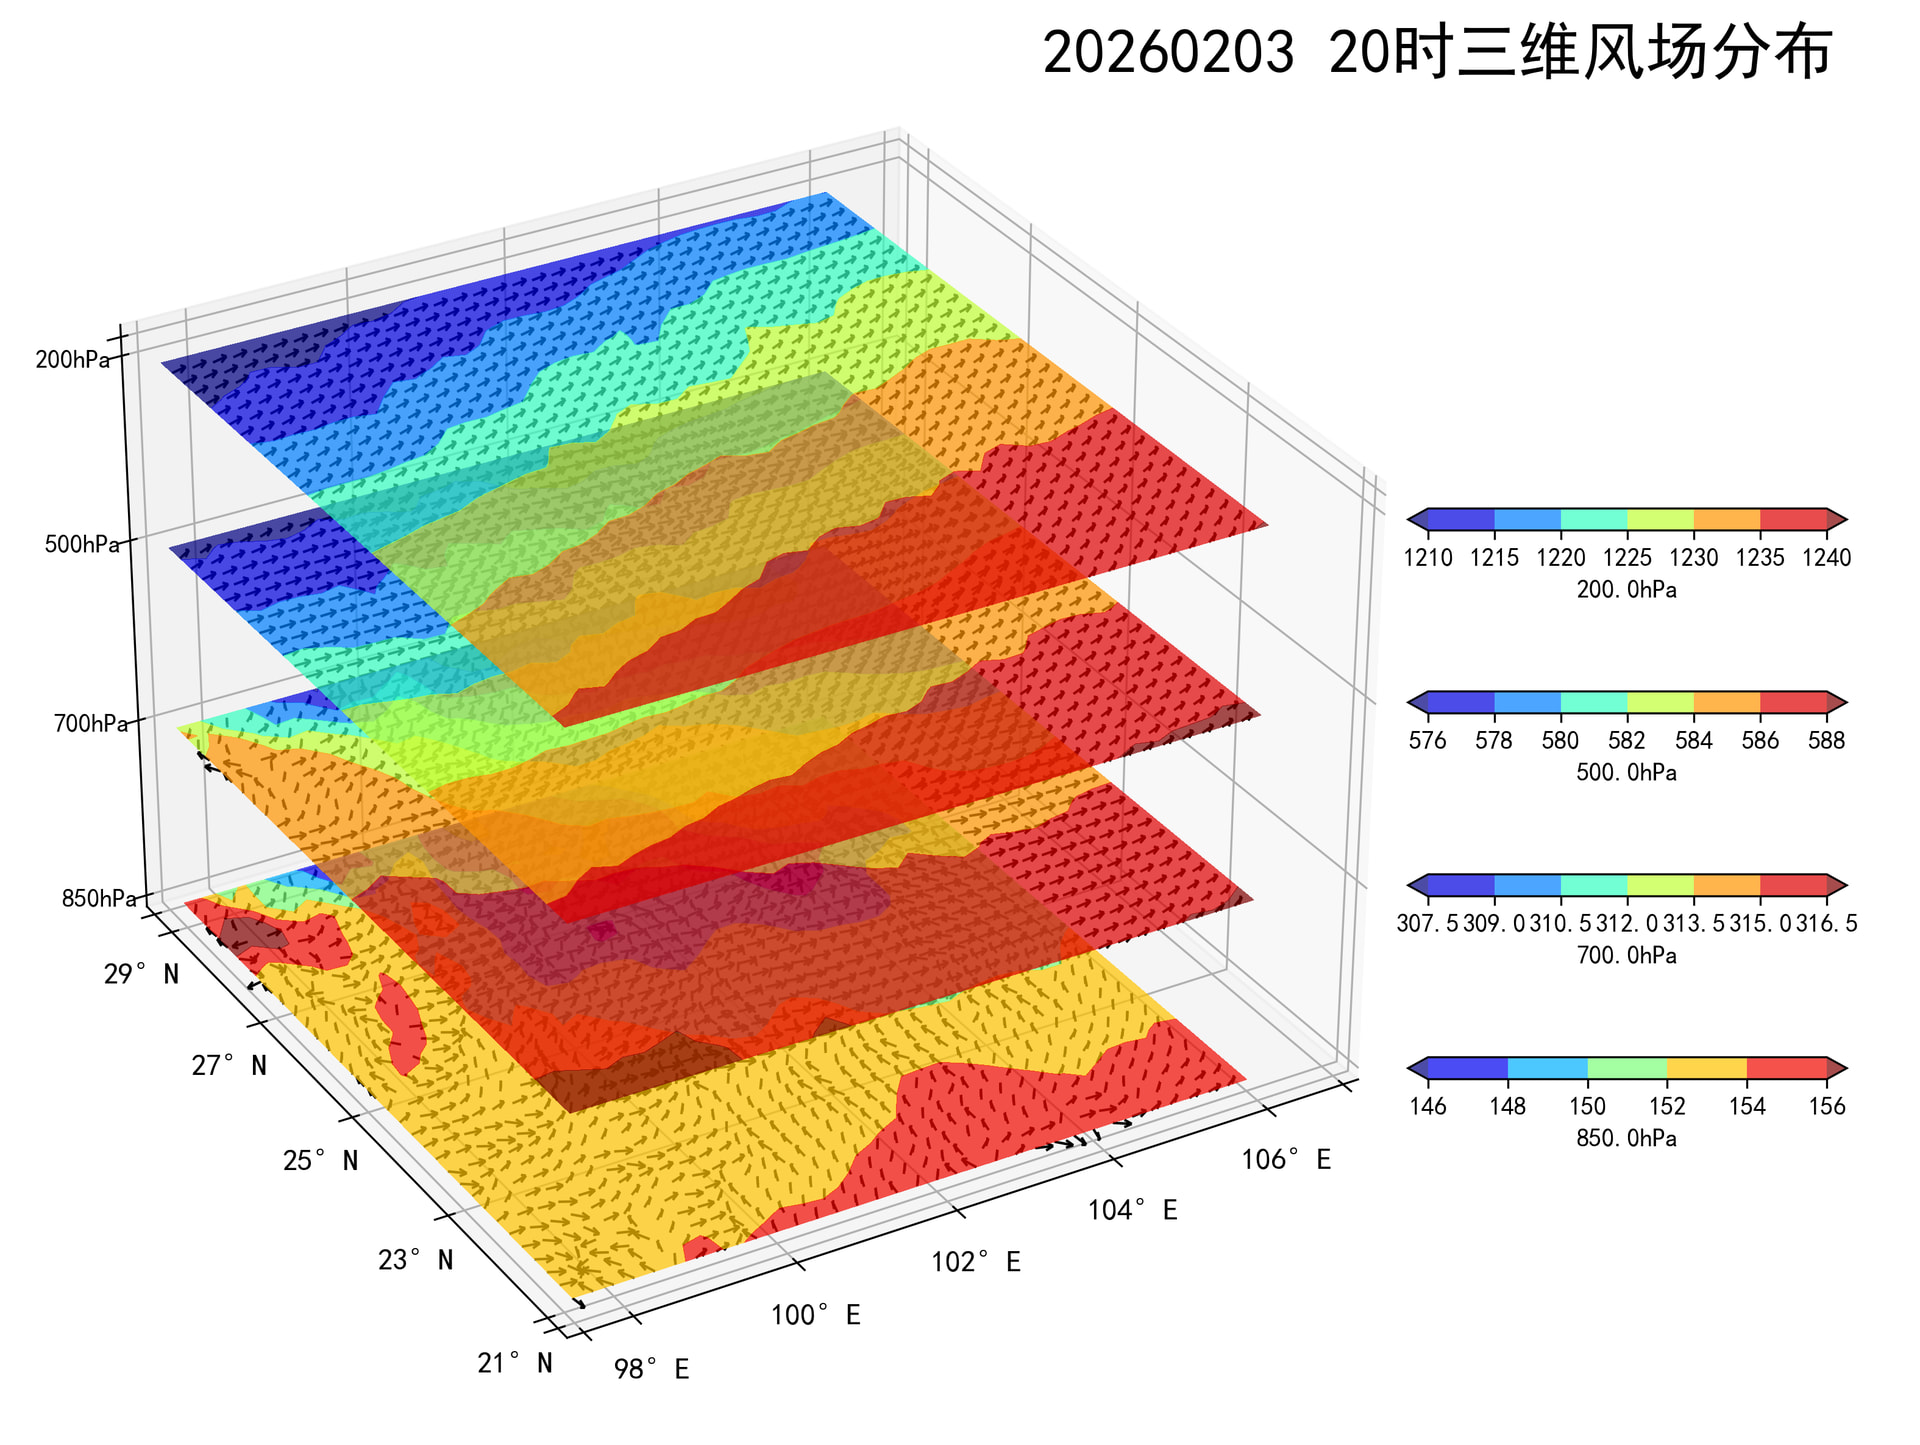
Python matplotlib 3D drawing always overrides Quiver drawing in 3D coordinate system with contour drawing, setting Zorder and adjusting the order of drawing are invalid.
请帮助我
代码:
lon = gh_grid.lon.values
lat = gh_grid.lat.values

lat_start_index = int(round((21 - np.min(lat)) / 0.25, 0))
lat_end_index = int(round((29.4 - np.min(lat)) / 0.25, 0))
lon_start_index = int(round((97.4 - np.min(lon)) / 0.25, 0))
lon_end_index = int(round((106.3 - np.min(lon)) / 0.25, 0))
lon = lon[lon_start_index:lon_end_index]
lat = lat[lat_start_index:lat_end_index]
lon, lat = np.meshgrid(lon, lat)

gh_values = gh_values[lat_start_index:lat_end_index, lon_start_index:lon_end_index]
u_values = u_values[lat_start_index:lat_end_index, lon_start_index:lon_end_index]
v_values = v_values[lat_start_index:lat_end_index, lon_start_index:lon_end_index]
# 创建规范化对象
ax.contourf(lon, lat, gh_values, zdir="z", offset=level, cmap='jet', alpha=0.7, extend='both')
ax.quiver(lon, lat, np.full_like(gh_values, level), u_values,
          v_values, np.zeros_like(gh_values),
          length=0.2, normalize=True, color='black', arrow_length_ratio=0.4,
          linewidth=1, linestyle='solid')