Hello, this might be useful for someone.
import matplotlib.pyplot as plt
import numpy as np
from matplotlib.patches import BoxStyle
from matplotlib.path import Path
class MyStyle3:
"""A RIGHT pointy box adopted from custom_boxstyle01"""
def __init__(self, pad=0.3):
self.pad = pad
super().__init__()
def __call__(self, x0, y0, width, height, mutation_size):
# padding
pad = mutation_size * self.pad
# width and height with padding added
width = width
height = height + 2.*pad
# boundary of the padded box
x0, y0 = x0 - pad, y0 - pad
x1, y1 = x0 + width, y0 + height
# return the new path
# (x0, y0) : lower left corner of rectangle
# (x1, y1) : upper right corner of rectangle
return Path([(x0, y0),
(x1, y0), (x1,(y0+y1)*.25), (x1+pad, (y0+y1)/2.),
(x1,(y0+y1)*.75),(x1, y1),
(x0, y1), (x0, y0)], closed=True)
class MyStyle2:
"""A LEFT pointy box adopted from custom_boxstyle01"""
def __init__(self, pad=0.3):
self.pad = pad
super().__init__()
def __call__(self, x0, y0, width, height, mutation_size):
# padding
pad = mutation_size * self.pad
# width and height with padding added
width = width
height = height + 2.*pad
# boundary of the padded box
x0, y0 = x0 + pad, y0 - pad
x1, y1 = x0 + width, y0 + height
# print(f"{mutation_size} {pad} tip point: {x0-pad}, {(y0+y1)/2.}")
# return the new path
# (x0, y0) : lower left corner of rectangle
# (x1, y1) : upper right corner of rectangle
return Path([(x0, y0),
(x1, y0), (x1, y1), (x0, y1),(x0,(y0+y1)*.75),
(x0-pad, (y0+y1)/2.), (x0,(y0+y1)*.25), (x0, y0)], closed=True)
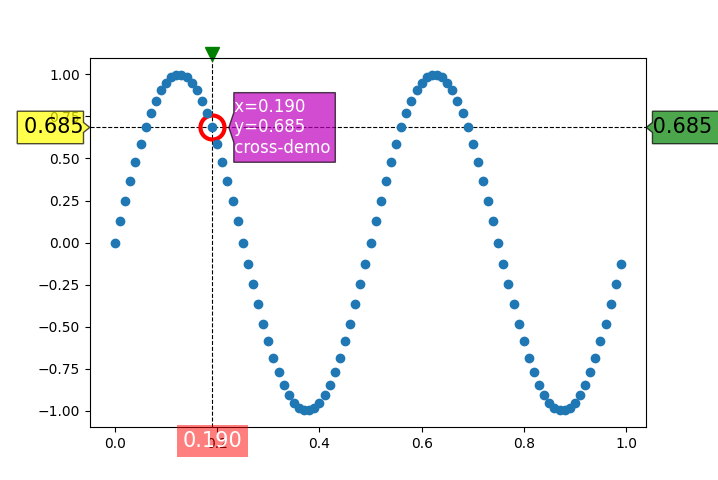
class SnaptoCursorEx:
"""
Like Cursor but the crosshair snaps to the nearest x point
"""
def __init__(self, ax, x, y):
self.ax = ax
# self.fp = fp
self.lx = ax.axhline(color='k', lw=0.8, ls="--") # the horiz line
self.ly = ax.axvline(color='k', lw=0.8, ls="--") # the vert line
self.x = x
self.y = y
self.xm = len(x)
BoxStyle._style_list["lpointy"] = MyStyle2 # Register the custom style.
BoxStyle._style_list["rpointy"] = MyStyle3 # Register the custom style.
self.txt = ax.text( 0.5, 0.5, '',size=12, transform=ax.transAxes)
self.crossMarker, = ax.plot(0, 0, linewidth=0, marker="o", color="red", markersize=np.sqrt(300), markerfacecolor='none', markeredgewidth=3)
# along y-axis
self.tvL = ax.text(0.5, 0.8, "", size=15, va="center", ha="left", rotation=0, bbox=dict(boxstyle="rpointy, pad=0.3", fc="yellow", alpha=0.7))
self.tvR = ax.text(0.5, 0.8, "", size=15, va="center", ha="left", rotation=0, bbox=dict(boxstyle="lpointy, pad=0.3", fc="green", alpha=0.7))
self.tvCx = ax.text(0.5, 0.8, "", size=12, va="center", ha="left", color='w', rotation=0, bbox=dict(boxstyle="lpointy, pad=0.3", fc="m", alpha=0.7))
# along x-axis
# text location in axes coords
self.th = ax.text(
0, 0, '', ha="center", va="top", rotation=0, size=15, color='w',
bbox=dict(boxstyle="rarrow,pad=0.0", fc="none", ec="b", lw=2))
bb = self.th.get_bbox_patch()
bb.set_boxstyle("square", pad=0.0)
self.th.set_bbox(dict(alpha=0.5, fc="red", ec="none", lw=2))
# top marker only
self.tm, = ax.plot(0., 1.0, 'gv', linestyle='None', markersize=10, clip_on=False, visible=False)
def on_mouse_move(self, event):
if not event.inaxes: return
x, y = event.xdata, event.ydata
indx = np.searchsorted(self.x, [x])[0]
if indx < self.xm:
x = self.x[indx]
y = self.y[indx]
elif indx == self.xm:
x = self.x[indx-1]
y = self.y[indx-1]
# update the line positions
self.lx.set_ydata(y)
self.ly.set_xdata(x)
# print(x, y)
self.crossMarker.set_data(x, y)
fig.canvas.draw()
bottom, top = ax.get_ylim()
dy = (top-bottom)*0.01
self.th.set_text("{0:.3f}".format(x))
self.th.set_position((x, bottom-dy))
left, right = ax.get_xlim()
dx = (right-left)*0.01
self.tvL.set_text("{0:.3f} ".format(y)) # right-pointy
self.tvL.set_position((left, y)) # left of y-axis
self.tvL.set_ha('right') # right text alignment
self.tvR.set_text(" {0:.3f}".format(y)) # left-pointy
self.tvR.set_position((right, y)) # Rightside of y-axis
self.tvR.set_ha('left') # left text alignment
self.tvCx.set_text(" x={0:.3f}\n y={1:.3f}\n cross-demo".format(x, y))
self.tvCx.set_position((x+3*dx, y)) # cross point x-offset +3*dx (marker size)
self.tvCx.set_ha('left') # left text alignment
# self.txt.set_text('x={0:,.3f}, y={1:,.3f}'.format(x, y))
# self.txt.set_position((0.5, top-dy))
self.tm.set_data(x, top+dy)
self.tm.set_visible(True)
self.ax.figure.canvas.draw_idle()
if __name__ == "__main__":
t = np.arange(0.0, 1.0, 0.01)
s = np.sin(2*2*np.pi*t)
fig, ax = plt.subplots()
cursor = SnaptoCursorEx(ax, t, s)
fig.canvas.mpl_connect('motion_notify_event', cursor.on_mouse_move)
ax.plot(t, s, 'o')
plt.show()