Im having an issue where contourf is producing visible defects in the shaded contours (within png output) with alpha values that are less then 1.0.
Ive attached two images.
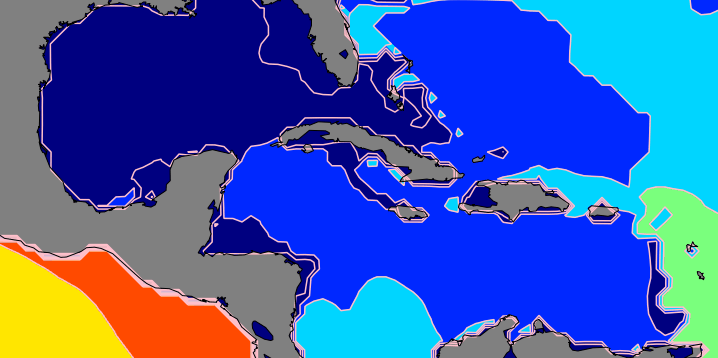
- the first image,contourf_no_alpha.png, shows my contour plot with the alpha value left at its default
(i.e.,alpha is not set, so alpha=1.0).
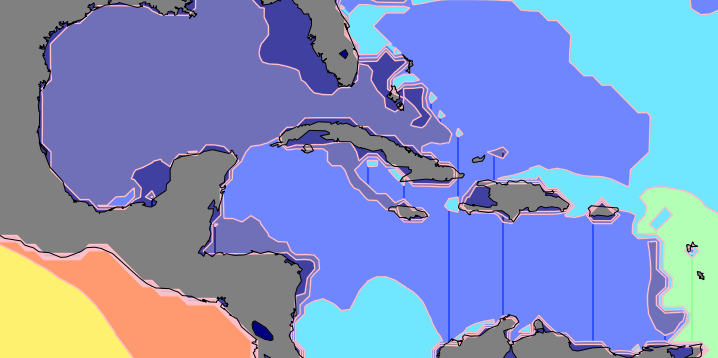
- the second image, contourf_with_alpha.png, shows the same contoured data, yet with the alpha set to 0.75.
There are vertical lines visible where the contours are apparently being closed/joined?
I added pink contour lines in order to show that these vertical lines are NOT actually part of the contour.
these are the commands that I used:
Z=create_my_data()
...
# image 1 (contourf_no_alpha.png)
cs=m.contourf(X,Y,Z,lev)
cs=m.contour(X,Y,Z,lev,colors='pink'linewidths=1.5)
# image 2 (contourf_with_alpha.png)
cs=m.contourf(X,Y,Z,lev,alpha=0.75)
cs=m.contour(X,Y,Z,lev,colors='pink',linewidths=1.5)
Im running the latest versions of basemap&matplotlib.
How can I remove these vertical defects while still being able to use "semi-transparent" alpha values?
Please help,
Thanks,
P.Romero
···
_________________________________________________________________
Hotmail® is up to 70% faster. Now good news travels really fast.
http://windowslive.com/online/hotmail?ocid=TXT_TAGLM_WL_HM_70faster_032009