Thank you, now are plt.text in the coordinates. Unfortunately, now overlapping the x and y coordinates.
How is it possible to solve this problem?
···
On 30/08/10 23:34, Ryan May wrote:
On Mon, Aug 30, 2010 at 4:44 AM, xyz<mitlox@...269...> wrote:
On 30/08/10 03:51, Benjamin Root wrote:
maxy = max(max(y1), max(y2))
maxx = max(x)ax.set_xlim((0.0, maxx))
ax.set_ylim((0.0, maxy))Thank you, but unfortunately I have still the same problems:
* plt.text appears outside x and y coordinates
* and the coordinates starts not from 0with the updated code:
from pylab import *
import matplotlib.pyplot as pltx = [1, 2, 3, 4, 5, 6, 7, 8, 9, 10, 11, 12, 13, 14, 15, 16, 17, 18, 19,
20, 21, 22, 23, 24, 25, 26, 27, 28, 29]
y1 = [20, 24, 8, 4, 12, 22, 31, 25, 15, 28, 12, 27, 22, 22, 27, 14, 32,
28, 8, 17, 2, 8, 29, 13, 14, 20, 11, 28, 8]
y2= [2, 32, 28, 1, 22, 11, 14, 27, 3, 31, 12, 20, 32, 24, 24, 16, 7, 10,
12, 11, 3, 32, 10, 20, 14, 14, 3, 25, 14]
point_labels1 = ['A=1', 'A=1', 'A=1', 'A=1', 'A=1', 'A=1', 'A=1', 'A=1',
'A=1', 'A=1', 'A=1', 'A=1', 'A=1', 'A=1', 'A=1', 'A=1', 'A=1', 'A=1',
'A=1']
point_labels2 = ['B=1', 'B=1', 'B=1', 'B=1', 'B=1', 'B=1', 'B=1', 'B=1',
'B=1', 'B=1', 'B=1', 'B=1', 'B=1', 'B=1', 'B=1', 'B=1', 'B=1', 'B=1',
'B=1']fig = plt.figure()
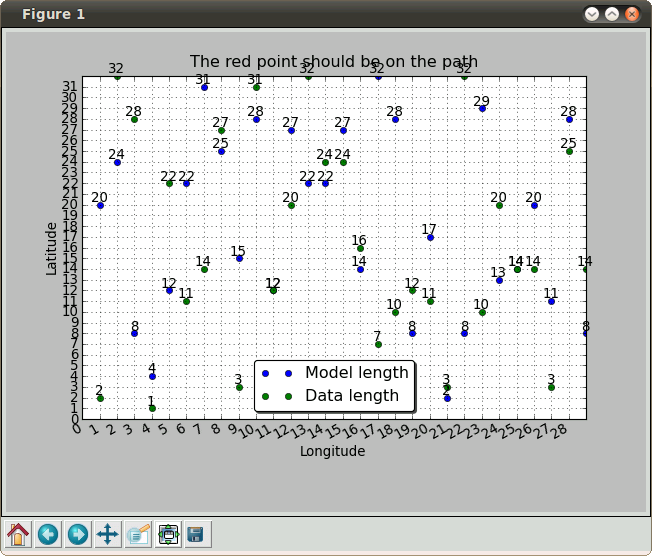
ax = fig.add_subplot(111)ax.set_title('The red point should be on the path')
plt.plot(x, y1, 'bo', x, y2, 'go')
ax.grid(True)
maxy = max(max(y1), max(y2))
maxx = max(x)ax.set_xlim((0.0, maxx))
ax.set_ylim((0.0, maxy))fig.autofmt_xdate()
plt.xticks(range(0, 40, 1))
plt.yticks(range(0, 40, 1))
plt.xlabel('Longitude')
plt.ylabel('Latitude')
plt.legend(('Model length', 'Data length'),
'best', shadow=True, fancybox=True)for i, label in enumerate(y1):
plt.text (x[i], y1[i]+0.2, label,
horizontalalignment='center' )for i, label in enumerate(y2):
plt.text (x[i], y2[i]+0.2, label,
horizontalalignment='center' )ax.autoscale_view()
plt.savefig('test.png')
plt.show()What did I wrong?
Like Eric said, the call to ax.autoscale_view() overrides the limits
you set by hand. Remove this line.Ryan