Hi,
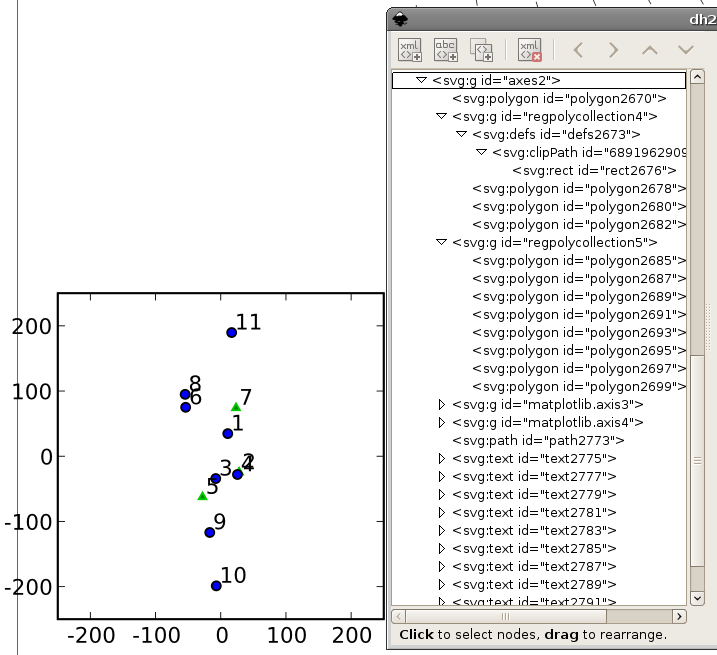
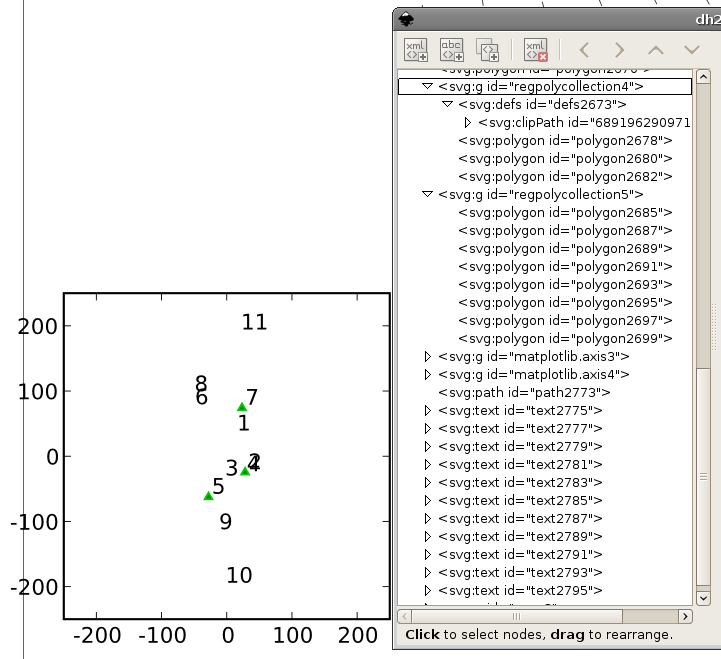
I have a problem with the svg output of matplotlib. I created a scatter plot and saved it to svg. For the scatter plot I used two kinds of symbols to mark different types of data. Afterwards I opened the file using Inkscape to make some minor modifications. When opening the file it looked fine (see Screenshot1.png). However, to do the modifications I had to 'ungroup' the axis. After that one group of the two markers disappeared from the plot (see Screenshot2.png). The data is however not deleted, it's just invisible in Inkscape (but not in Firefox ;-).
I suspect it has to do with the clipPath definition, which is defined for the regpolycollection4 (the green triangles, which are plotted first) but not for the regploycollection5 (the blue dots, which are plotted second).
Is there any reason why a clipPath is defined for only one of the Collections? I'm not sure whether this is a bug in matplotlib svg output or Inkscape, but naively I would say that Inkscape behaves correct here.
Hope this can be fixed,
Manuel
Uuuu, btw. I'm using matplotlib 0.90.1
···
--
---------------------------------------
Manuel Metz ............ [email protected]...
Argelander Institut fuer Astronomie
Auf dem Huegel 71 (room 3.06)
D - 53121 Bonn
E-Mail: [email protected]...
Web: www.astro.uni-bonn.de/~mmetz
Phone: (+49) 228 / 73-3660
Fax: (+49) 228 / 73-3672
---------------------------------------
I stumbled over the same problem over and over again, as well.
I think it is difficult to blame either inkscape or matplotlib. The SVG
code is correct and Inkscape displays it correctly. The difficulty is
that the SVG standard does not say anything about the correct *editing*
behavior. The "ungroup" of inkscape seems to handle the definitions
within the group that is ungrouped in such a way that the individual
elements cannot access them correctly any more.
I think the best fix would be in both, matplotlib and inkscape.
matplotlib has no need to put the definitions inside the group and can
simply avoid that, but still inkscape should cope with this kind of
(legal!) SVG code in a better way.
Manuel Metz wrote:
···
Hi,
I have a problem with the svg output of matplotlib. I created a
scatter plot and saved it to svg. For the scatter plot I used two
kinds of symbols to mark different types of data. Afterwards I opened
the file using Inkscape to make some minor modifications. When opening
the file it looked fine (see Screenshot1.png). However, to do the
modifications I had to 'ungroup' the axis. After that one group of the
two markers disappeared from the plot (see Screenshot2.png). The data
is however not deleted, it's just invisible in Inkscape (but not in
Firefox ;-).
I suspect it has to do with the clipPath definition, which is defined
for the regpolycollection4 (the green triangles, which are plotted
first) but not for the regploycollection5 (the blue dots, which are
plotted second).
Is there any reason why a clipPath is defined for only one of the
Collections? I'm not sure whether this is a bug in matplotlib svg
output or Inkscape, but naively I would say that Inkscape behaves
correct here.
Hope this can be fixed,
Manuel
Uuuu, btw. I'm using matplotlib 0.90.1
------------------------------------------------------------------------
------------------------------------------------------------------------
------------------------------------------------------------------------
-------------------------------------------------------------------------
This SF.net email is sponsored by DB2 Express
Download DB2 Express C - the FREE version of DB2 express and take
control of your XML. No limits. Just data. Click to get it now.
http://sourceforge.net/powerbar/db2/
------------------------------------------------------------------------
_______________________________________________
Matplotlib-devel mailing list
[email protected]
matplotlib-devel List Signup and Options
Hm, after I messed around some time with inkscape I finally found a workaround - not nice, but it worked - at least for this particular case.
I just copied the plot and pasted it again. Then I could ungroup the plot and now inkscape behaved as expected, I still see all my data points. Strange enough, inkscape did not change the structure of the svg code ...
Norbert Nemec wrote:
···
I stumbled over the same problem over and over again, as well.
I think it is difficult to blame either inkscape or matplotlib. The SVG
code is correct and Inkscape displays it correctly. The difficulty is
that the SVG standard does not say anything about the correct *editing*
behavior. The "ungroup" of inkscape seems to handle the definitions
within the group that is ungrouped in such a way that the individual
elements cannot access them correctly any more.
I think the best fix would be in both, matplotlib and inkscape.
matplotlib has no need to put the definitions inside the group and can
simply avoid that, but still inkscape should cope with this kind of
(legal!) SVG code in a better way.
Manuel Metz wrote:
Hi,
I have a problem with the svg output of matplotlib. I created a
scatter plot and saved it to svg. For the scatter plot I used two
kinds of symbols to mark different types of data. Afterwards I opened
the file using Inkscape to make some minor modifications. When opening
the file it looked fine (see Screenshot1.png). However, to do the
modifications I had to 'ungroup' the axis. After that one group of the
two markers disappeared from the plot (see Screenshot2.png). The data
is however not deleted, it's just invisible in Inkscape (but not in
Firefox ;-).
I suspect it has to do with the clipPath definition, which is defined
for the regpolycollection4 (the green triangles, which are plotted
first) but not for the regploycollection5 (the blue dots, which are
plotted second).
Is there any reason why a clipPath is defined for only one of the
Collections? I'm not sure whether this is a bug in matplotlib svg
output or Inkscape, but naively I would say that Inkscape behaves
correct here.
Hope this can be fixed,
Manuel
Uuuu, btw. I'm using matplotlib 0.90.1
------------------------------------------------------------------------
------------------------------------------------------------------------
------------------------------------------------------------------------
-------------------------------------------------------------------------
This SF.net email is sponsored by DB2 Express
Download DB2 Express C - the FREE version of DB2 express and take
control of your XML. No limits. Just data. Click to get it now.
http://sourceforge.net/powerbar/db2/
------------------------------------------------------------------------
_______________________________________________
Matplotlib-devel mailing list
[email protected]
matplotlib-devel List Signup and Options
-------------------------------------------------------------------------
This SF.net email is sponsored by DB2 Express
Download DB2 Express C - the FREE version of DB2 express and take
control of your XML. No limits. Just data. Click to get it now.
http://sourceforge.net/powerbar/db2/
_______________________________________________
Matplotlib-devel mailing list
[email protected]
matplotlib-devel List Signup and Options
--
---------------------------------------
Manuel Metz ............ [email protected]...
Argelander Institut fuer Astronomie
Auf dem Huegel 71 (room 3.06)
D - 53121 Bonn
E-Mail: [email protected]...
Web: www.astro.uni-bonn.de/~mmetz
Phone: (+49) 228 / 73-3660
Fax: (+49) 228 / 73-3672
---------------------------------------