<insert praise>I first want to thank you for the awesome plotting
package. I used it to generate some figures for a recent publication
in Geophysical Research Letters.</insert praise>
Now on to the bug. There seems to be a problem in the new colorbar
with the extend keyword in matplotlib version 0.87.3.
The colors/labels on the colorbar are screwed up if I do contourf
plots of arrays in which all of the values are below the minimum
contour or above the maximum contour.
I've illustrated the problem using the simple script below. (scroll
farther down to see the png attachment)
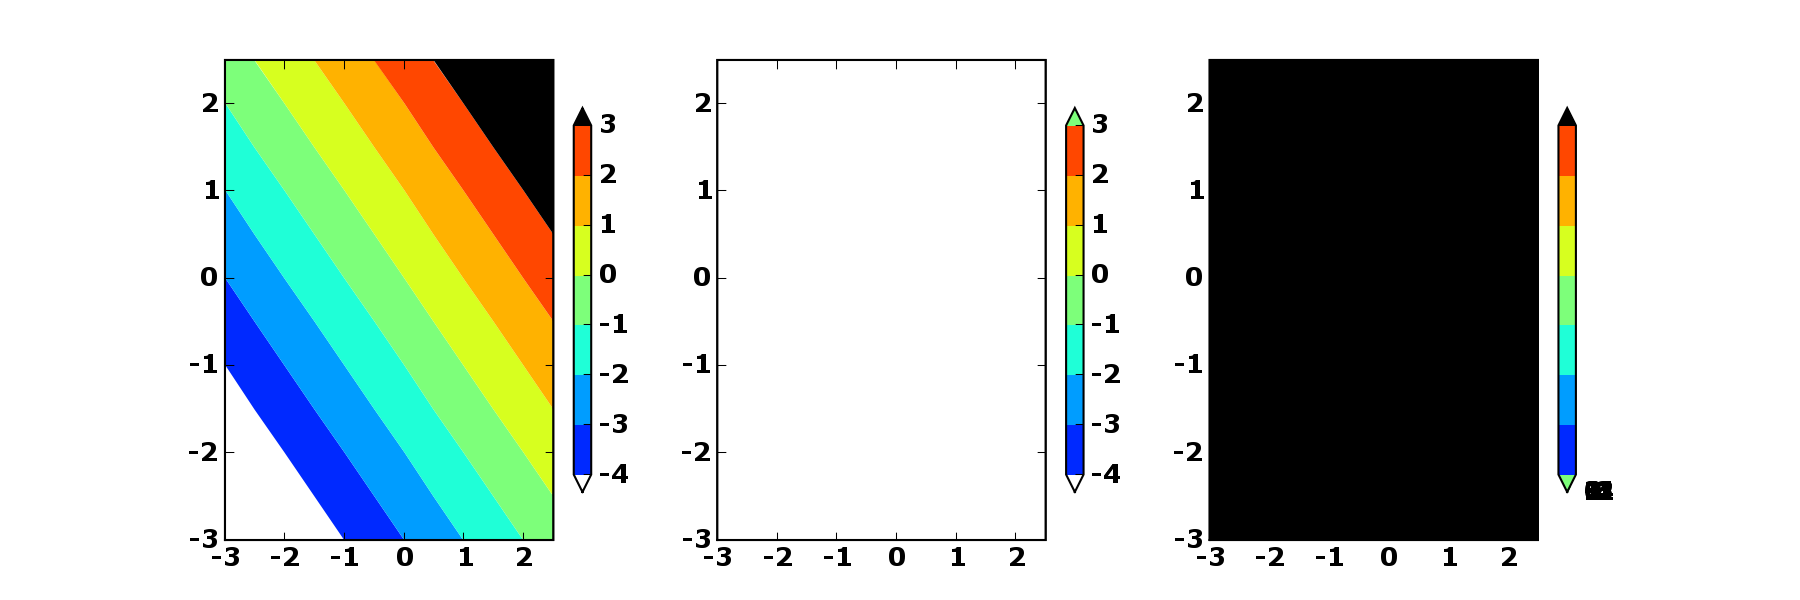
* Left plot has array values within the minimum and maximum contours
and the colorbar is okay.
* Middle plot has array values lower than the smallest contour. The
uppermost color in the colorbar is incorrect (it should be black, not
green).
* Right plot has array values higher than the largest contour. The
lower color in the colorbar is incorrect and the labels are in the
wrong positions.
#--------begin script--------#
from pylab import *
palette = cm.jet
palette.set_over('black', 1.0)
palette.set_under('white', 1.0)
x = y = arange(-3.0, 3.0, 0.5)
X, Y = meshgrid(x, y)
Z = X + Y
conts = [-4,-3,-2,-1,0,1,2,3]
fig = figure(figsize=(12,4))
subplot(131)
plt = contourf(X, Y, Z, conts, cmap=palette, extend='both')
colorbar(plt, extend='both', shrink=0.8)
subplot(132)
plt = contourf(X, Y, Z-10, conts, cmap=palette, extend='both')
colorbar(plt, extend='both', shrink=0.8)
subplot(133)
plt = contourf(X, Y, Z+10, conts, cmap=palette, extend='both')
colorbar(plt, extend='both', shrink=0.8)
show()
#---------end script---------#