I am trying to make an errorbar plot with a logarithmic x-axis. I have symmetric errors in logspace, however if I plot them, the errors are not symmetric anymore, as you can see in the enclosed image. Am I misunderstanding something or is this a bug?
If you error bars denote standard deviation of standard error of mean,
shouldn't they be non-symmetric in log scale?
Shawn
···
On Tue, Apr 7, 2015 at 10:11 AM, Markus Haider <[email protected]...> wrote:
Hi,
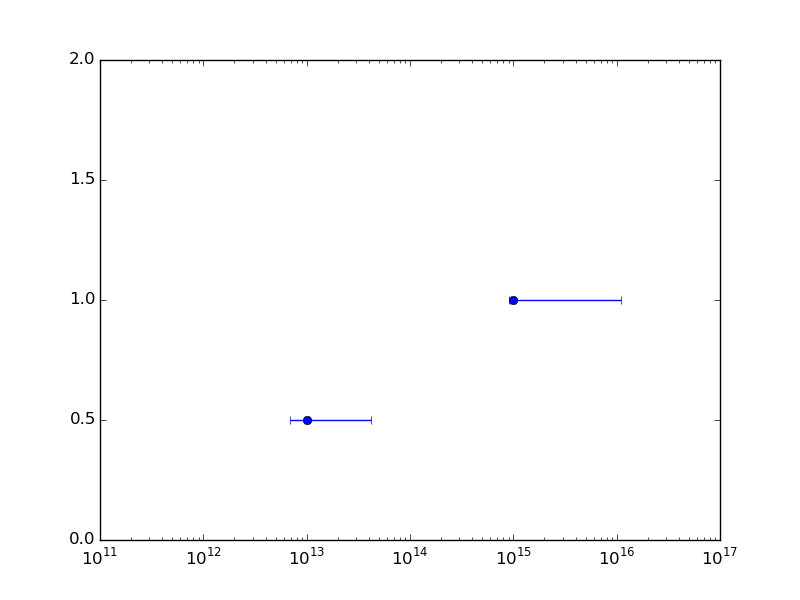
I am trying to make an errorbar plot with a logarithmic x-axis. I have
symmetric errors in logspace, however if I plot them, the errors are not
symmetric anymore, as you can see in the enclosed image. Am I
misunderstanding something or is this a bug?
------------------------------------------------------------------------------
BPM Camp - Free Virtual Workshop May 6th at 10am PDT/1PM EDT
Develop your own process in accordance with the BPMN 2 standard
Learn Process modeling best practices with Bonita BPM through live exercises http://www.bonitasoft.com/be-part-of-it/events/bpm-camp-virtual- event?utm_
source=Sourceforge_BPM_Camp_5_6_15&utm_medium=email&utm_campaign=VA_SF
_______________________________________________
Matplotlib-users mailing list [email protected] matplotlib-users List Signup and Options
Typo - "standard deviation OR standard error of mean", not "OF".
Sorry.
Shawn
···
On Tue, Apr 7, 2015 at 10:39 AM, Yuxiang Wang <[email protected]...> wrote:
If you error bars denote standard deviation of standard error of mean,
shouldn't they be non-symmetric in log scale?
Shawn
On Tue, Apr 7, 2015 at 10:11 AM, Markus Haider <[email protected]...> wrote:
Hi,
I am trying to make an errorbar plot with a logarithmic x-axis. I have
symmetric errors in logspace, however if I plot them, the errors are not
symmetric anymore, as you can see in the enclosed image. Am I
misunderstanding something or is this a bug?
------------------------------------------------------------------------------
BPM Camp - Free Virtual Workshop May 6th at 10am PDT/1PM EDT
Develop your own process in accordance with the BPMN 2 standard
Learn Process modeling best practices with Bonita BPM through live exercises http://www.bonitasoft.com/be-part-of-it/events/bpm-camp-virtual- event?utm_
source=Sourceforge_BPM_Camp_5_6_15&utm_medium=email&utm_campaign=VA_SF
_______________________________________________
Matplotlib-users mailing list [email protected] matplotlib-users List Signup and Options
I have the error from a table which is in log units, and the error is given to be symmetric in log space.
Cheers,
Markus
···
On 2015-04-07 16:40, Yuxiang Wang wrote:
Typo - "standard deviation OR standard error of mean", not "OF".
Sorry.
Shawn
On Tue, Apr 7, 2015 at 10:39 AM, Yuxiang Wang <[email protected]...> wrote:
If you error bars denote standard deviation of standard error of mean,
shouldn't they be non-symmetric in log scale?
Shawn
On Tue, Apr 7, 2015 at 10:11 AM, Markus Haider <[email protected]...> wrote:
Hi,
I am trying to make an errorbar plot with a logarithmic x-axis. I have
symmetric errors in logspace, however if I plot them, the errors are not
symmetric anymore, as you can see in the enclosed image. Am I
misunderstanding something or is this a bug?
------------------------------------------------------------------------------
BPM Camp - Free Virtual Workshop May 6th at 10am PDT/1PM EDT
Develop your own process in accordance with the BPMN 2 standard
Learn Process modeling best practices with Bonita BPM through live exercises http://www.bonitasoft.com/be-part-of-it/events/bpm-camp-virtual- event?utm_
source=Sourceforge_BPM_Camp_5_6_15&utm_medium=email&utm_campaign=VA_SF
_______________________________________________
Matplotlib-users mailing list [email protected] matplotlib-users List Signup and Options
*xerr*/*yerr*: [ scalar | N, Nx1, or 2xN array-like ]
If a scalar number, len(N) array-like object, or an Nx1
array-like object, errorbars are drawn at +/-value relative
to the data.
If a sequence of shape 2xN, errorbars are drawn at -row1
and +row2 relative to the data.
On 7 Apr 2015, at 13:51 PM, Markus Haider <[email protected]...> wrote:
I have the error from a table which is in log units, and the error is
given to be symmetric in log space.
Cheers,
Markus
On 2015-04-07 16:40, Yuxiang Wang wrote:
Typo - "standard deviation OR standard error of mean", not "OF".
Sorry.
Shawn
On Tue, Apr 7, 2015 at 10:39 AM, Yuxiang Wang <[email protected]...> wrote:
If you error bars denote standard deviation of standard error of mean,
shouldn't they be non-symmetric in log scale?
Shawn
On Tue, Apr 7, 2015 at 10:11 AM, Markus Haider <[email protected]....> wrote:
Hi,
I am trying to make an errorbar plot with a logarithmic x-axis. I have
symmetric errors in logspace, however if I plot them, the errors are not
symmetric anymore, as you can see in the enclosed image. Am I
misunderstanding something or is this a bug?
------------------------------------------------------------------------------
BPM Camp - Free Virtual Workshop May 6th at 10am PDT/1PM EDT
Develop your own process in accordance with the BPMN 2 standard
Learn Process modeling best practices with Bonita BPM through live exercises http://www.bonitasoft.com/be-part-of-it/events/bpm-camp-virtual- event?utm_
source=Sourceforge_BPM_Camp_5_6_15&utm_medium=email&utm_campaign=VA_SF
_______________________________________________
Matplotlib-users mailing list [email protected] matplotlib-users List Signup and Options
Thank you very much for your help. You are right, this is what I wanted
Cheers,
Markus
···
On 2015-04-07 23:33, Jody Klymak wrote:
xerr is +/- relative to the data:
*xerr*/*yerr*: [ scalar | N, Nx1, or 2xN array-like ]
If a scalar number, len(N) array-like object, or an Nx1
array-like object, errorbars are drawn at +/-value relative
to the data.
If a sequence of shape 2xN, errorbars are drawn at -row1
and +row2 relative to the data.
On 7 Apr 2015, at 13:51 PM, Markus Haider <[email protected]...> wrote:
I have the error from a table which is in log units, and the error is
given to be symmetric in log space.
Cheers,
Markus
On 2015-04-07 16:40, Yuxiang Wang wrote:
Typo - "standard deviation OR standard error of mean", not "OF".
Sorry.
Shawn
On Tue, Apr 7, 2015 at 10:39 AM, Yuxiang Wang <[email protected]...> wrote:
If you error bars denote standard deviation of standard error of mean,
shouldn't they be non-symmetric in log scale?
Shawn
On Tue, Apr 7, 2015 at 10:11 AM, Markus Haider <[email protected]...> wrote:
Hi,
I am trying to make an errorbar plot with a logarithmic x-axis. I have
symmetric errors in logspace, however if I plot them, the errors are not
symmetric anymore, as you can see in the enclosed image. Am I
misunderstanding something or is this a bug?
------------------------------------------------------------------------------
BPM Camp - Free Virtual Workshop May 6th at 10am PDT/1PM EDT
Develop your own process in accordance with the BPMN 2 standard
Learn Process modeling best practices with Bonita BPM through live exercises http://www.bonitasoft.com/be-part-of-it/events/bpm-camp-virtual- event?utm_
source=Sourceforge_BPM_Camp_5_6_15&utm_medium=email&utm_campaign=VA_SF
_______________________________________________
Matplotlib-users mailing list [email protected] matplotlib-users List Signup and Options