theres a fairly wide gap showing up around the top&left
edges of my plot.
Im trying to do the following:
Import numpy as np
Z=my_data( …)
m=basemap( … )
X,Y=m(*np.meshgrid(Z.lon,Z.lat))
Znp=Z.filled
cs=m.contourf(X,Y,Znp)
using this method, Im experiencing a strange gap around the
left&top edges of the plot.
It seems as if the contour data is not aligning correctly
with the basemap, or is somehow ‘falling short’ of filling in the
entire area.
Ive used this same method to plot other contour plots and
have never experienced this type of gap (using the same version of
basemap/matplotlib/numpy/etc.).
Im not sure if there’s something wrong with the way Im
creating my data, or if this is a problem with basemap.
In either case, can someone please provide me with some help
figuring out why that gap is appearing?
Ive attached an npz file with my 3 arrays: X,Y,Znp.
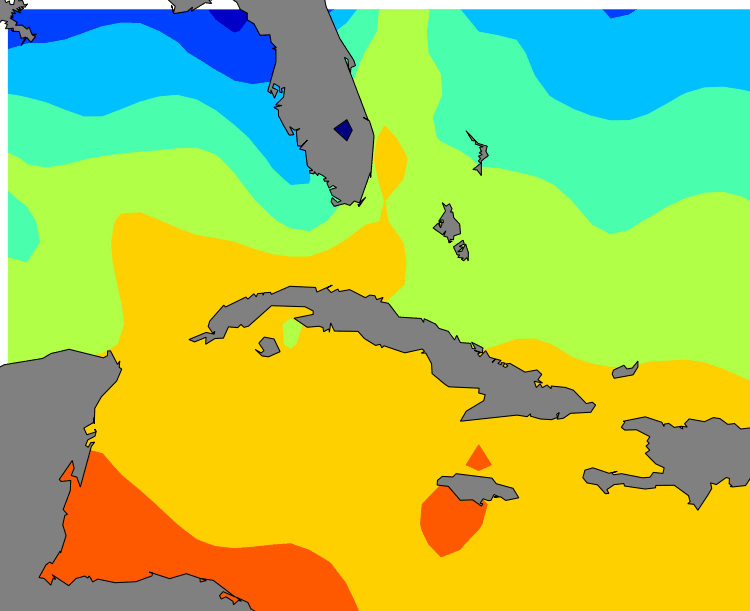
Ive also attached a png image of my output, where the gap is
clearly evident around the left&top edges.
theres a fairly wide gap showing up around the top&left edges of my plot.
Im trying to do the following:
Import numpy as np
Z=my_data( �)
m=basemap( � )
X,Y=m(*np.meshgrid(Z.lon,Z.lat))
Znp=Z.filled
cs=m.contourf(X,Y,Znp)
using this method, Im experiencing a strange gap around the left&top edges of the plot.
It seems as if the contour data is not aligning correctly with the basemap, or is somehow �falling short� of filling in the entire area.
Ive used this same method to plot other contour plots and have never experienced this type of gap (using the same version of basemap/matplotlib/numpy/etc.).
Im not sure if there�s something wrong with the way Im creating my data, or if this is a problem with basemap.
In either case, can someone please provide me with some help figuring out why that gap is appearing?
Ive attached an npz file with my 3 arrays: X,Y,Znp.
Ive also attached a png image of my output, where the gap is clearly evident around the left&top edges.
Thanks,
P.Romero
Pablo: Please include a working example that creates your example plot.
Jeff,
I've attached a test script and my data file.
Unfortunately, the method that Im using to create the data set isn't very
portable (the data is being imported from an external program), so sending
my .npz file is the best I can do.
The gaps are about 5 pixels, and create an offset from where the contours
end to where the basemap hits the edge of the plot.
Please let me know if there's something in my data set that could be causing
this, or if its an issue with basemap.
-----Original Message-----
From: Jeff Whitaker [mailto:jswhit@…146…]
Sent: 2009-04-06 6:13 AM
To: P.Romero
Cc: matplotlib-users@lists.sourceforge.net
Subject: Re: [Matplotlib-users] problem with basemap & my data arrays, gap
around plot edge
P.Romero wrote:
Hi,
Im having a problem with contourf & basemap;
theres a fairly wide gap showing up around the top&left edges of my plot.
Im trying to do the following:
Import numpy as np
Z=my_data( .)
m=basemap( . )
X,Y=m(*np.meshgrid(Z.lon,Z.lat))
Znp=Z.filled
cs=m.contourf(X,Y,Znp)
using this method, Im experiencing a strange gap around the left&top
edges of the plot.
It seems as if the contour data is not aligning correctly with the
basemap, or is somehow 'falling short' of filling in the entire area.
Ive used this same method to plot other contour plots and have never
experienced this type of gap (using the same version of
basemap/matplotlib/numpy/etc.).
Im not sure if there's something wrong with the way Im creating my
data, or if this is a problem with basemap.
In either case, can someone please provide me with some help figuring
out why that gap is appearing?
Ive attached an npz file with my 3 arrays: X,Y,Znp.
Ive also attached a png image of my output, where the gap is clearly
evident around the left&top edges.
Thanks,
P.Romero
Pablo: Please include a working example that creates your example plot.
Jeff,
I've attached a test script and my data file.
Unfortunately, the method that Im using to create the data set isn't very
portable (the data is being imported from an external program), so sending
my .npz file is the best I can do.
The gaps are about 5 pixels, and create an offset from where the contours
end to where the basemap hits the edge of the plot.
Please let me know if there's something in my data set that could be causing
this, or if its an issue with basemap.
Thanks,
P.Romero
Pablo: The extend of your map projection region is
The reason you get the gap along the top edge is that the data doesn't extend all the way to the northern boundary of the map region. Just shrink your map region a little bit and it will go away.
-Jeff
···
-----Original Message-----
From: Jeff Whitaker [mailto:jswhit@…146…] Sent: 2009-04-06 6:13 AM
To: P.Romero
Cc: matplotlib-users@lists.sourceforge.net
Subject: Re: [Matplotlib-users] problem with basemap & my data arrays, gap
around plot edge
P.Romero wrote:
Hi,
Im having a problem with contourf & basemap;
theres a fairly wide gap showing up around the top&left edges of my plot.
Im trying to do the following:
Import numpy as np
Z=my_data( .)
m=basemap( . )
X,Y=m(*np.meshgrid(Z.lon,Z.lat))
Znp=Z.filled
cs=m.contourf(X,Y,Znp)
using this method, Im experiencing a strange gap around the left&top edges of the plot.
It seems as if the contour data is not aligning correctly with the basemap, or is somehow 'falling short' of filling in the entire area.
Ive used this same method to plot other contour plots and have never experienced this type of gap (using the same version of basemap/matplotlib/numpy/etc.).
Im not sure if there's something wrong with the way Im creating my data, or if this is a problem with basemap.
In either case, can someone please provide me with some help figuring out why that gap is appearing?
Ive attached an npz file with my 3 arrays: X,Y,Znp.
Ive also attached a png image of my output, where the gap is clearly evident around the left&top edges.
Thanks,
P.Romero
Pablo: Please include a working example that creates your example plot.
-Jeff
--
Jeffrey S. Whitaker Phone : (303)497-6313
Meteorologist FAX : (303)497-6449
NOAA/OAR/PSD R/PSD1 Email : Jeffrey.S.Whitaker@...259...
325 Broadway Office : Skaggs Research Cntr 1D-113
Boulder, CO, USA 80303-3328 Web : Jeffrey S. Whitaker: NOAA Physical Sciences Laboratory