Problem with an unresponsive slider controlling two plots on a tkinter figure canvas

Using Python 3.9, matplotlib 3.4, Mac OS 11.6.1. My code below constructs a function that takes as its inputs two lists of 4-by-4 matrices having the same length. Upon a tkinter canvas I want to use a single slider to animate the corresponding sequences of heatplots on two separate sets of axes. The problem is that the slider becomes unresponsive after its value changes a couple times. What I have so far:

import numpy as np
import matplotlib.pyplot as plt
import random
from matplotlib.widgets import Slider
from matplotlib.backends.backend_tkagg import FigureCanvasTkAgg
from tkinter import Tk,TOP,BOTH,Toplevel
import matplotlib
matplotlib.use('TkAgg',force=True)

def scrolling_matrix_viewer(M_list,N_list):    
    plot_window = Toplevel()  # tkinter Toplevel upon which the figure canvas is placed.
    plot_window.geometry('1000x900')
    plot_window.attributes('-topmost', 'true')

    fig, ax = plt.subplots(2,sharex=True)

    canvas = FigureCanvasTkAgg(fig, master=plot_window) #place figure on canvas
    canvas.draw()
    canvas.get_tk_widget().pack(side=TOP,fill=BOTH,expand=1)

    fig.subplots_adjust(left=.09, bottom=.2, right=None, top=.9, wspace=.2, 
    hspace=.2)
    Nt=len(M_list) # number of matrices in each list
    ax_time=fig.add_axes([0.15, 0.1, 0.65, 0.03]) # axis for slider
    spos = Slider(ax_time, '',valinit=0,valmin=0,valmax=Nt-1,valstep=1)

    def update_graph(val):
            t=spos.val
            if t<=Nt:
               ax[0].cla
               ax[1].cla
               heatmap0=ax[0].imshow(M_list[t],vmin=0, vmax=1, cmap='coolwarm', 
               aspect='auto',extent=[0,4,4,0])
               heatmap1=ax[1].imshow(N_list[t],vmin=0, vmax=1, cmap='coolwarm', 
               aspect='auto',extent=[0,4,4,0])

    spos.on_changed(update_graph)
    spos.set_val(0)
    return spos

Now test the function using two lists of 4-by-4 matrices

root=Tk()

M=[np.random.rand(4,4) for t in range(50)]
N=[np.random.rand(4,4) for t in range(50)]
scrolling_matrix_viewer(M,N)

root.mainloop()

The slider becomes unresponsive after I click on it twice. This is not an issue when the task is not incorporated into a function or when only one matrix sequence is used. Additionally, it is not an issue when I don’t use tkinter for purposes of embedding the figure on a canvas.
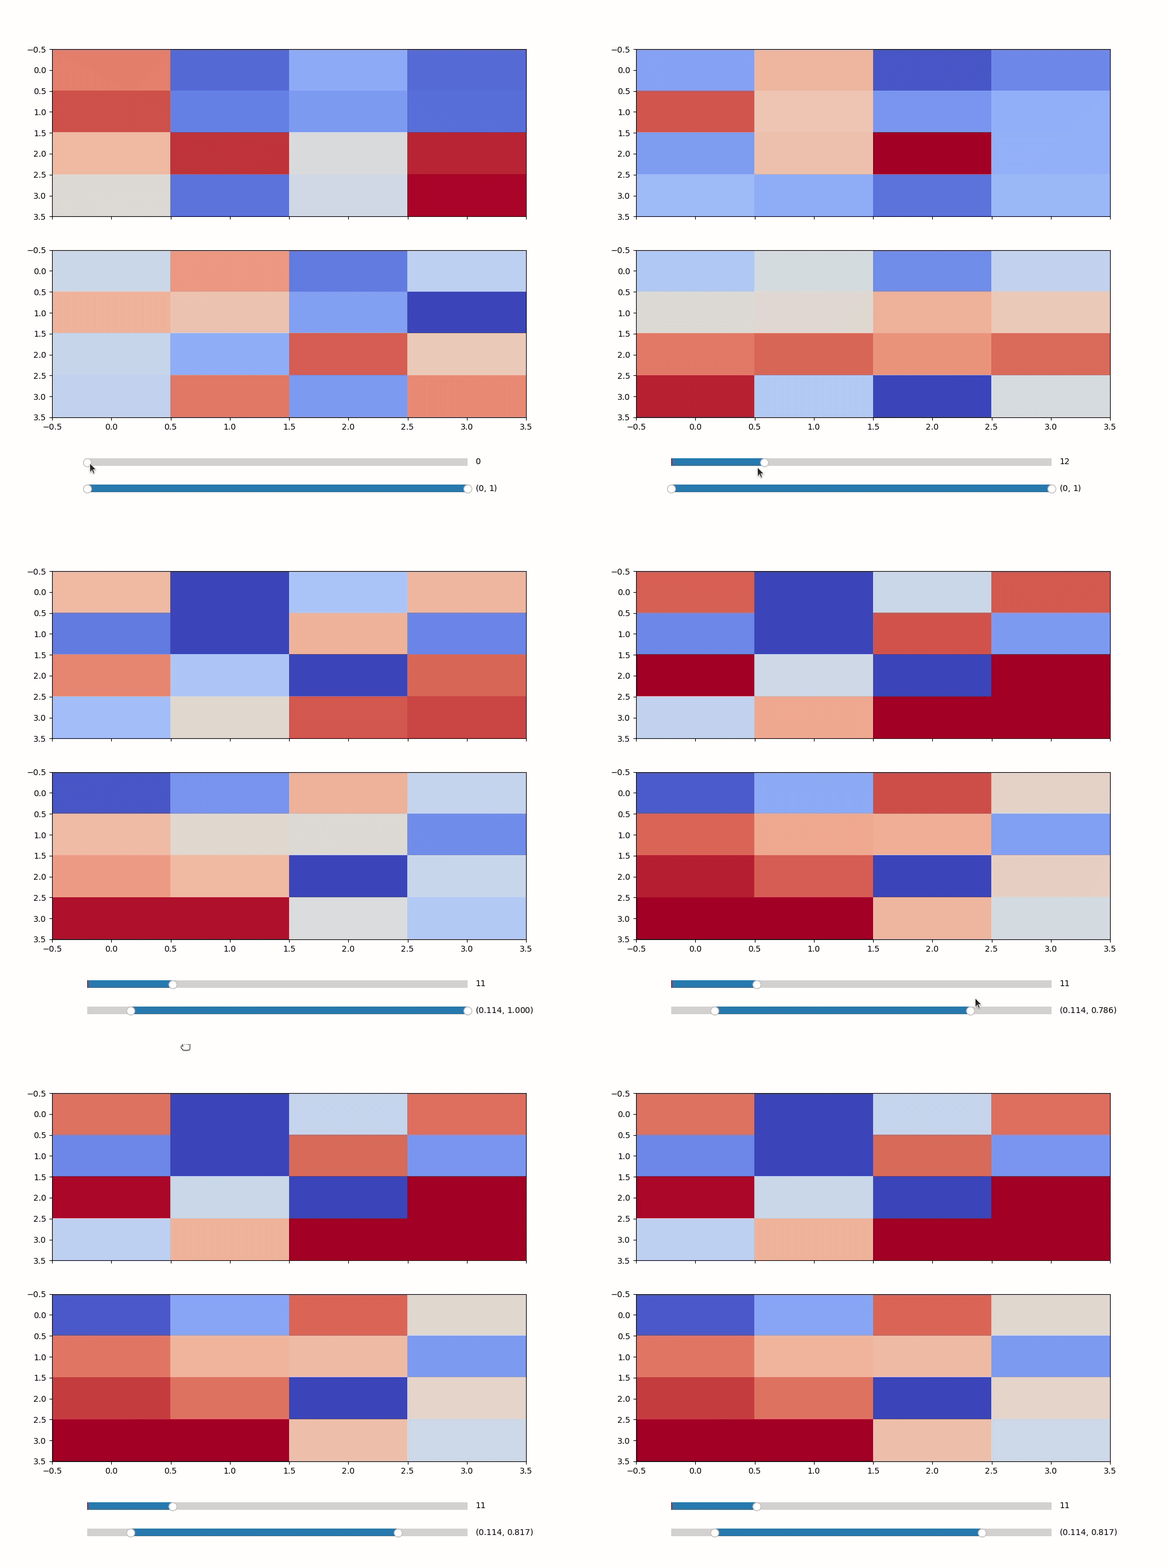
I think you need to change two things:

  1. actually call cla so change ax.cla to ax.cla()
  2. hold on to a reference to the slider:
spos = scrolling_matrix_viewer...

Great! That did the trick! Thanks so much.

you can also get better performance by using heatmap0.set_data instead of cla and calling imshow to make a new image every time. You can either implement that that manually, or let mpl-interactions (package i wrote) handle that for you. mpl-interactions would also make it easy to do nice things like use rangesliders to control vmin and vmax (paired for the subplots or a slider for each)

so your example could become:

from tkinter import BOTH, TOP, Tk, Toplevel

import matplotlib
import matplotlib.pyplot as plt
import numpy as np
from matplotlib.backends.backend_tkagg import FigureCanvasTkAgg
from matplotlib.widgets import RangeSlider, Slider

from mpl_interactions import indexer
from mpl_interactions.pyplot import interactive_imshow

matplotlib.use("TkAgg", force=True)

def scrolling_matrix_viewer(M_list, N_list):
    plot_window = Toplevel()  # tkinter Toplevel upon which the figure canvas is placed.
    plot_window.geometry("1000x900")
    plot_window.attributes("-topmost", "true")

    matplotlib.use("TkAgg", force=True)
    fig, ax = plt.subplots(2, sharex=True)

    canvas = FigureCanvasTkAgg(fig, master=plot_window)  # place figure on canvas
    canvas.draw()
    canvas.get_tk_widget().pack(side=TOP, fill=BOTH, expand=1)

    fig.subplots_adjust(left=0.09, bottom=0.2, right=None, top=0.9, wspace=0.2, hspace=0.2)
    Nt = len(M_list)  # number of matrices in each list
    ax_time = fig.add_axes([0.15, 0.1, 0.65, 0.03])  # axis for slider
    ax_scale = fig.add_axes([0.15, 0.05, 0.65, 0.03])  # axis for slider
    t_slider = Slider(ax_time, "", valinit=0, valmin=0, valmax=Nt - 1, valstep=1)
    r_slider = RangeSlider(ax_scale, "", valinit=(0, 1), valmin=0, valmax=1)

    kwargs = {
        "cmap": "coolwarm",
        # "vmin": 0,
        # "vmax": 1,
        "aspect": "auto",
    }

    ctrls = interactive_imshow(
        indexer(M_list, "time"), vmin_vmax=r_slider, time=t_slider, ax=ax[0], **kwargs
    )
    interactive_imshow(
        indexer(N_list, "time"),
        ax=ax[1],
        # you shouldn't have to pass vmin and vmax again, that's a bug in mpl-interactions
        vmin=ctrls["vmin"],
        vmax=ctrls["vmax"],
        **kwargs,
        controls=ctrls
    )

    return ctrls


root = Tk()

M = [np.random.rand(4, 4) for t in range(50)]
N = [np.random.rand(4, 4) for t in range(50)]
ctrls = scrolling_matrix_viewer(M, N)

root.mainloop()

which gives you this:
Peek 2022-01-25 15-55

Thanks. So I installed your package and ran the code above exactly as written. I received an error message,

Traceback (most recent call last):
File “/Users/fishbacp/Desktop/matplotlib_forum_matrix_stacker.py”, line 60, in
ctrls = scrolling_matrix_viewer(M, N)
File “/Users/fishbacp/Desktop/matplotlib_forum_matrix_stacker.py”, line 31, in scrolling_matrix_viewer
r_slider = RangeSlider(ax_scale, “”, valinit=(0, 1), valmin=0, valmax=1)
File “/Library/Frameworks/Python.framework/Versions/3.9/lib/python3.9/site-packages/matplotlib/widgets.py”, line 618, in init
valinit = self._value_in_bounds(valinit)
File “/Library/Frameworks/Python.framework/Versions/3.9/lib/python3.9/site-packages/matplotlib/widgets.py”, line 688, in _value_in_bounds
return (self._min_in_bounds(val[0]), self._max_in_bounds(val[1]))
File “/Library/Frameworks/Python.framework/Versions/3.9/lib/python3.9/site-packages/matplotlib/widgets.py”, line 672, in _min_in_bounds
if min > self.val[1]:
AttributeError: ‘RangeSlider’ object has no attribute ‘val’

Also, for my purposes, I only need a time axis. eventually, I’ll have a window size, in seconds, and will need for the slider to show the time values, not the actual indices. For example if the window size =.5 sec., then the slider values will show 0, .5, 1, 1.5, etc.

Ah I think that error is fixed in newer version so of maptlotlib.

need for the slider to show the time values, not the actual indices.

mpl-interactions actually can do this as well, e.g. in Hyperslicer Tutorial — mpl-interactions but for your use case I doing it all on your own is likely the easiest thing. I would recommend that you modify your update function to use set_data though like is done here:
https://github.com/ianhi/mpl-interactions/blob/0517177b687722f8d4ecf9fd89910986be3377b3/mpl_interactions/pyplot.py#L751-L761

Thanks so much. I’ll look into all of this more. PaulF