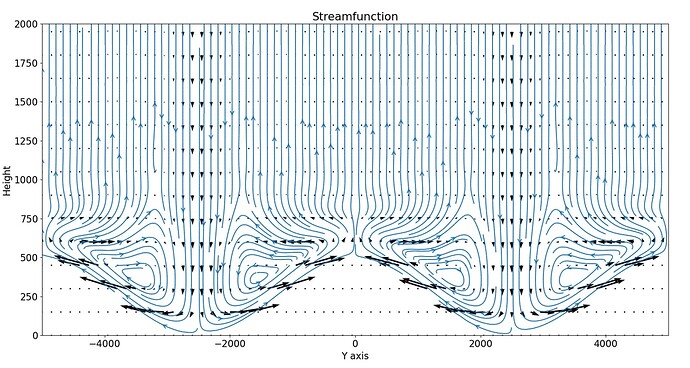
My 2-D vector plot using quiver is resulting in wind vectors that are not parallel to the streamlines. I have used the same syntax to plot both the streamlines and the wind vectors:
Following is the code used for plotting:
fig = plt.figure(figsize=(10,10))
plt.rcParams.update({‘font.size’:16})
plt.rcParams[‘contour.negative_linestyle’] = ‘solid’
plt.title(‘Streamfunction’)
jk = 15
q = plt.quiver(Y[::jk,::jk],Z[::jk,::jk],V[::jk,::jk],W[::jk,::jk],scale=50)
plt.streamplot(Y,Z,V,W,density = 3,arrowstyle=‘->’,arrowsize = 1.5)
plt.xlabel(“Y axis”)
plt.ylabel(“Height”)
plt.xlim([-5000,5000])
#plt.ylim([1000,10000])
plt.show()
Thank you!
