I am new to Matplotlib and am having some problems plotting the following set of coordinates (in python 2.6 and Win 7 32)
This is just a small sample of the data:
Seq.No. x-scale y-scale z-scale
01.000000 1579446.055280 5361974.495490 1342.967407
02.000000 1579446.646620 5361972.813700 1342.967407
03.000000 1579448.047050 5361968.830880 1341.237305
04.000000 1579450.992084 5361963.830880 1337.739502
05.000000 1579453.937117 5361958.830880 1336.262817
…
…
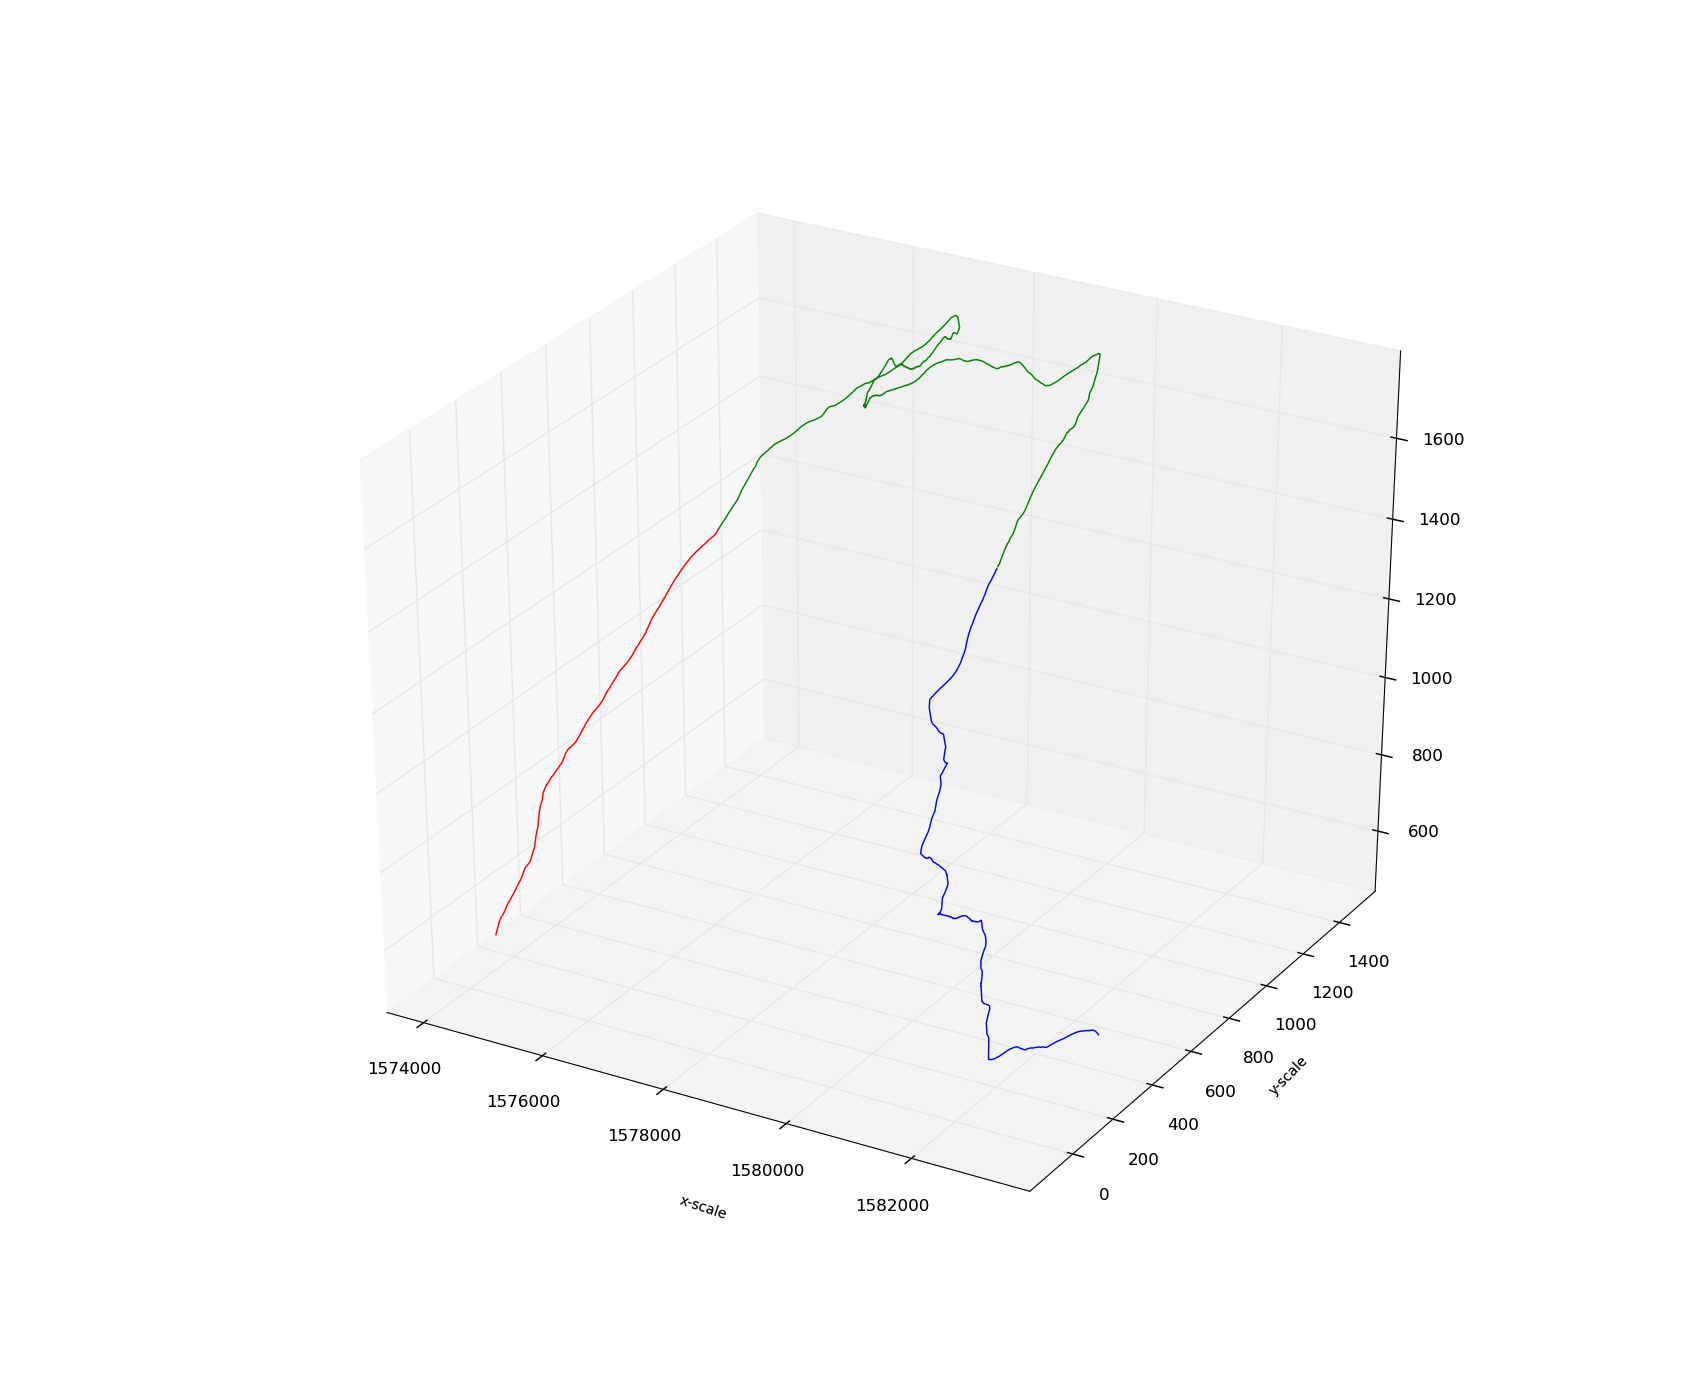
with the following outcome:
(plot3d.png)
Problem: while the x-scale is ok and the z-scale looks ok, the y-scale is definitely not ok. The numbers in the image are not the ones in the y-array (I double checked.)
I also have a number of questons:
Question1: how does one create a label for the z scale? (zlabel is not valid)
Queston2: Is it possible to fill below the line (so it looks like a mountain) and how
Question3: Is it possible to traverse sequentially all the points plotted in the image so as to make computations (such as distance to the next point, etc…).
The points themselves come from a text file but are not in sequence. They are sequenced by being plotted in their right position in 3D space.
This is the code I use to plot:
…
…
sx = np.array(x) #the x data extracted from a text file
sy = np.array(y) #the y data " "
sz = np.array(z) #the z data " "
Axes3D.plot(ax, sx, sy, sz)
xlabel(“x-scale”, horizontalalignment=‘right’, fontsize=‘small’, rotation=‘horizontal’)
ylabel(“y-scale”, horizontalalignment=‘right’, fontsize=‘small’, rotation=‘horizontal’)
savefig(“plot3d.png”)
…
…
Many thanks for your help.
George