Daniel,
The stacking problem is fairly well known (although not very well documented). However, this is not your bug.
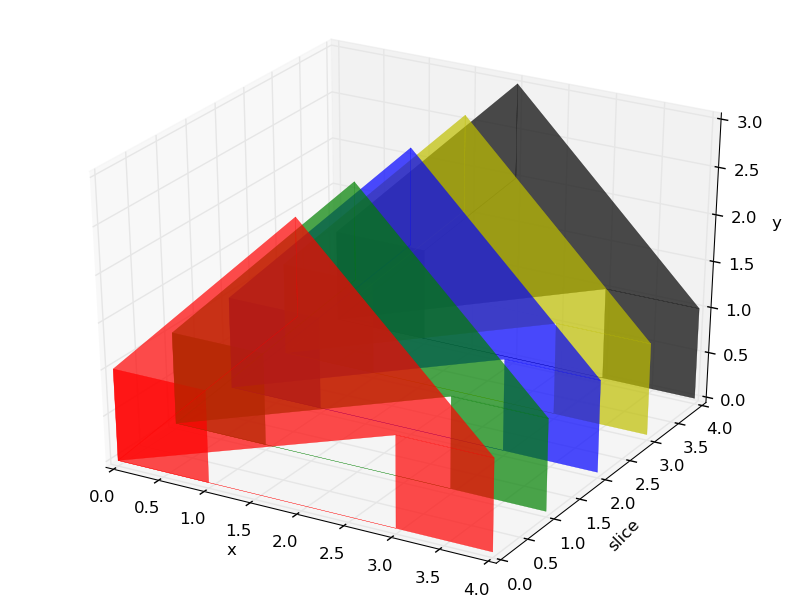
I haven’t exactly figure out what is wrong, but it appears that a fifth polygon is being drawn or something that is connecting back to the (0, 0) point. If you redefine your polygons a bit, you will see what I mean:
vertsQuad = [ [ (0,0), (0,1), (1,1), (1,0) ],
[ (4,1), (2,3), (2,2), (3,1)],
[ (0,1), (2,3), (2,2), (1,1)],
[ (3,0), (3,1), (4,1), (4,0)]]
As an additional note, your for-loop later in the code is a bit wrong:
zpos = [0, 1, 2, 3, 4]
for i in zpos :
…
zs = [zpos[i]]*len(vertsQuad)
In this case, you are using the values of zpos as both the z-location values and as an index back to itself. Try something like this:
zpos = [0, 1, 2, 3, 4]
for zval in zpos :
…
zs = [zval]*len(vertsQuad)
That way, the values in zpos can be any numerical value, in any order, and it makes for easier reading.
I will look a little bit further for the cause of your problem, but you can at least partly mitigate it by closing your polygon paths (this shouldn’t be necessary, but go figure…):
vertsQuad = [ [ (0,0), (0,1), (1,1), (1,0), (0,0) ],
      [ (4,1), (2,3), (2,2), (3,1), (4,1)],

      [ (0,1), (2,3), (2,2), (1,1), (0,1)],

      [ (3,0), (3,1), (4,1), (4,0), (3,0)]]
I hope this helps!
Ben Root
···
On Sat, Jan 8, 2011 at 4:07 PM, Daniel Mader <danielstefanmader@…982…> wrote:
Hello,
I have a problem with the 3D plotting of PolyCollections with
python-matplotlib-1.0.0 (on openSUSE 11.3 x86_64):
instead of being correctly stacked as in the example
http://matplotlib.sourceforge.net/examples/mplot3d/polys3d_demo.html,
the plots are weirdly overlapping. The example works OK for me but I
need a PolyCollection in order to plot the results of a couple of FEM
simulations…
Code is attached which demonstrates the problem. Any help is deeply appreciated!
Thanks a million times in advance,
best regards from Salzburg, Austria,
Daniel