I have a 2D array of data that is a result of a lidar scan through the atmosphere. Each scan through the atmosphere generates an [N, M] array of data. Where N is the laser pulse and M is the range bin. I have no issue creating a contour plot of the data in this form as it is evenly spaced.
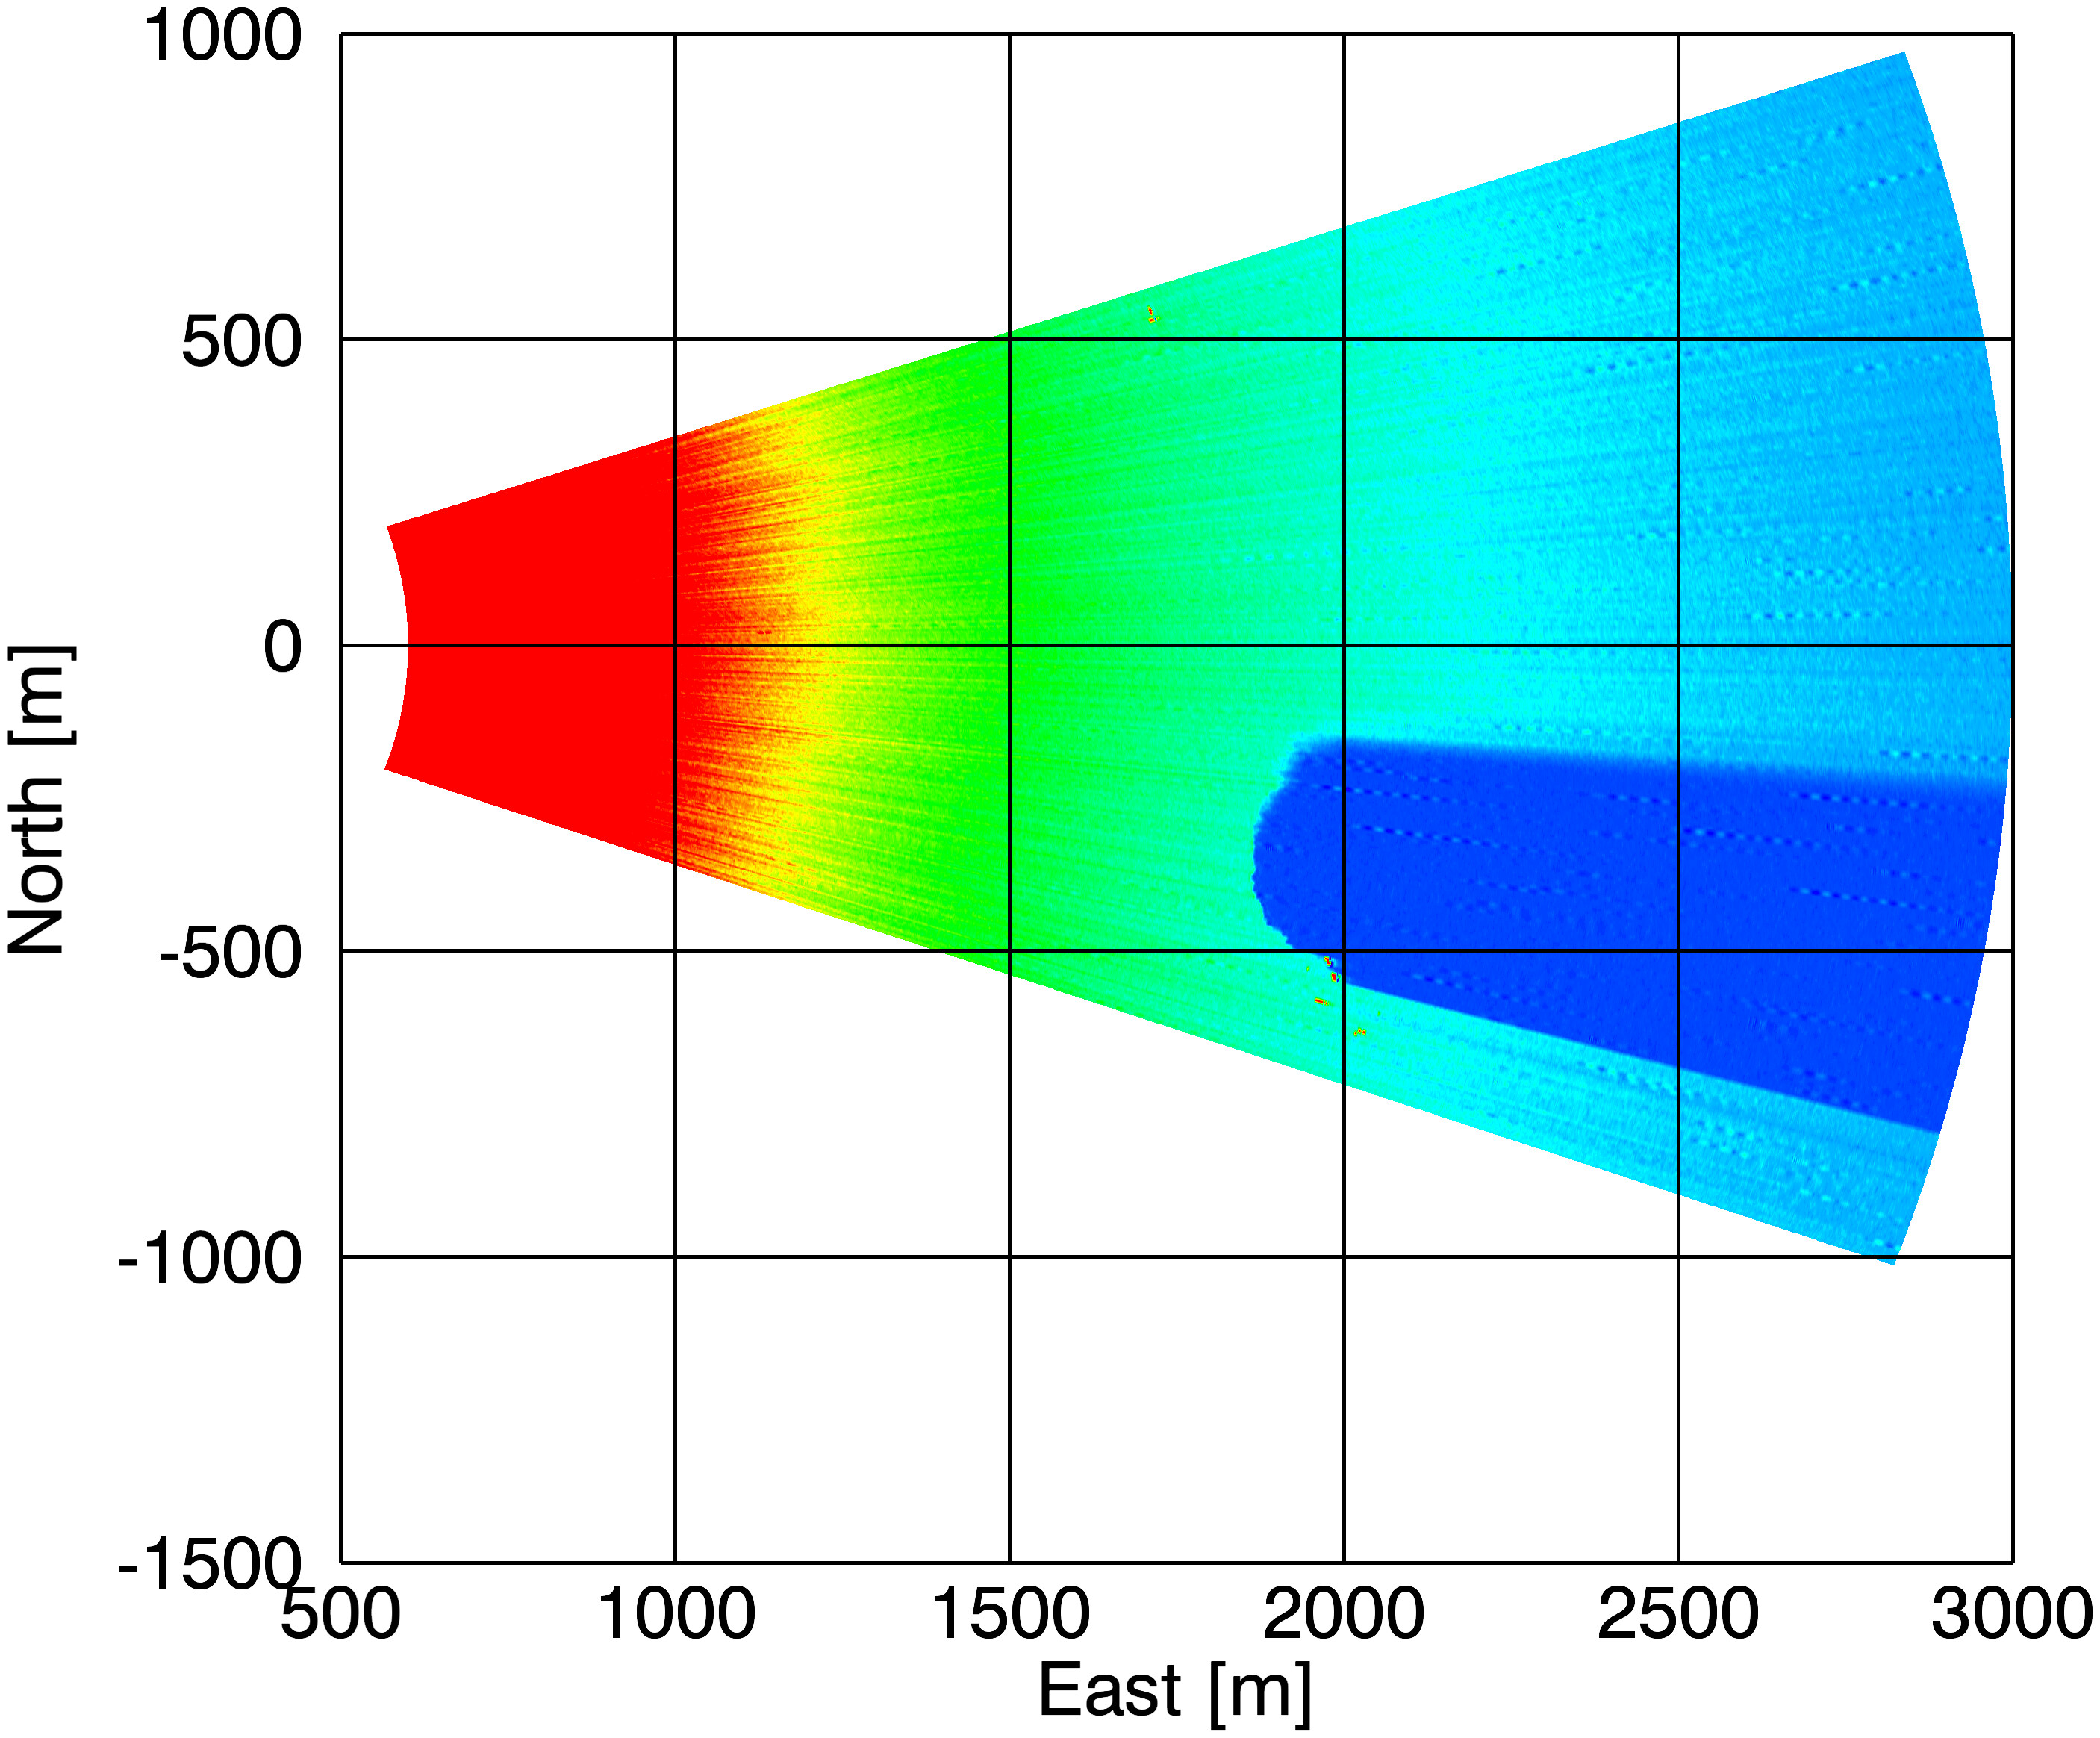
Since the system is scanning each of the N laser pulses is at a different azimuth angle. I would like to plot the data using the latitude and longitude for each data point.
ScanLon = [n,m] array of longitudes
ScanLat = [n,m] array of latitudes
ScanData = [n,m] array of intensity values
plt.contour(ScanLon, ScanLat, ScanData)
Generates a plot, but the contours appear as lines going in a circle.
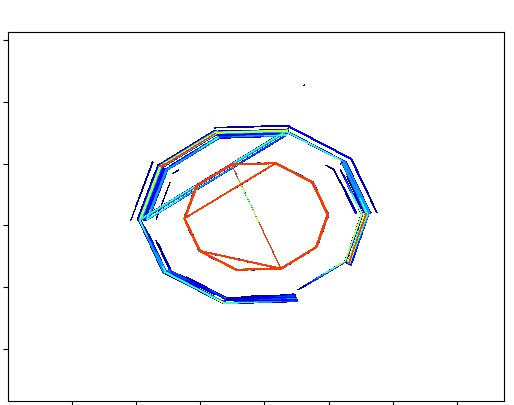
I was expecting something more of a pie wedge.
I’ve tried using the triangulation as follows, but…
x1 = np.linspace( MinLon, MaxLon), npnts)
y1 = np.linspace(MinLat, MaxLat, npnts)
triang = tri.Triangulation(ScanLon,ScanLat)
I get an error at this point “x and y must be equal-length 1D arrys”, but the rest follows from the triangulation example.
interpolator = tri.LinearTriInterpolator(triang,Scandata)
Xi, Yi = np.meshgrid(xi, yi)
zi = Interpolator(Xi, Yi)
If you have any suggestions I would appreciate it.