I have a question regarding a contour plot. I got a minimal working example which shows the issue. Let’s walk through that, my question is at the end.
Definition of functions g_1, g_2 and compound function g:
import matplotlib.pyplot as plt
import torch

w_1 = torch.tensor([0.9912, 1.0234])
w_10 = torch.tensor([-3.3894])

w_2 = torch.tensor([3.5639, 0.9837])
w_20 = torch.tensor([-15.5668])

def g_1(x):
    return x.matmul(w_1) + w_10

def g_2(x):
    return x.matmul(w_2) + w_20

def g(x):
    return g_1(x) / g_2(x)
When we plot g(x_1, x_2) at fixed x_2 = 2.0 we get the following plot:
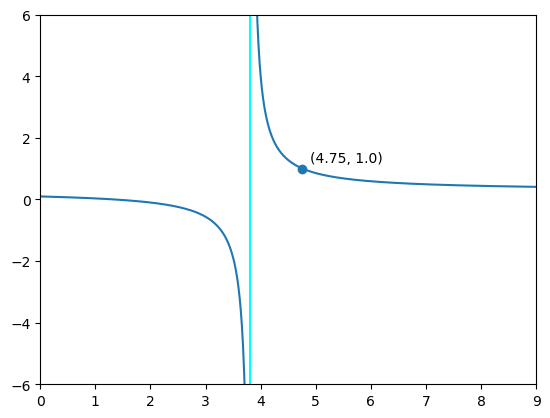
There is a discontinuity at around x_1 = 3.8 and g(x_1, 2.0) = 1 at around x_1 = 4.75.
Source of plot:
xmin = 0
xmax = 9
ymin = -6
ymax = 6

x = torch.arange(xmin, xmax, 0.01)
xx = torch.stack([x, torch.full(x.shape, 2.0)], dim=1)

z = g(xx)

fig, ax = plt.subplots()

idx = torch.argmax(torch.diff(torch.sign(z))) + 1
x[idx] = torch.nan
z[idx] = torch.nan

ax.set_xlim(xmin, xmax)
ax.set_ylim(ymin, ymax)

ax.vlines(x=3.80, ymin=ymin, ymax=ymax, colors='aqua')
ax.scatter(x=4.75, y=1.0)
ax.annotate('(4.75, 1.0)', (4.9, 1.2))

plt.plot(x, z)
plt.show()
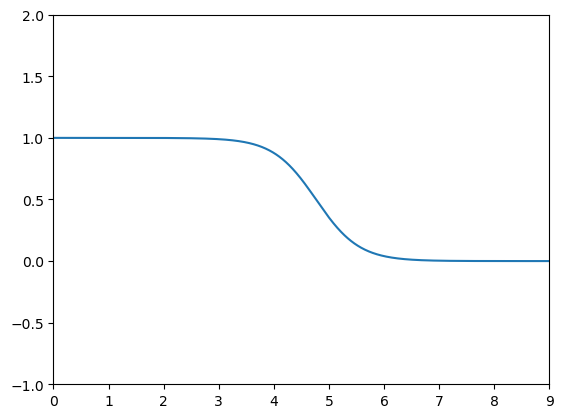
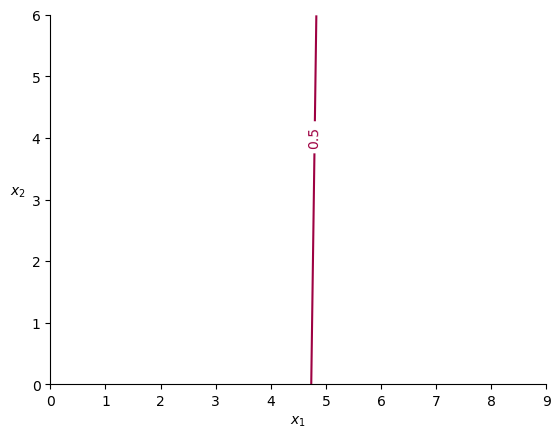
Now if we draw a contour plot of g(x) at the single level 1.0 (the case when g_1(x) = g_2(x)), then we get the following plot:
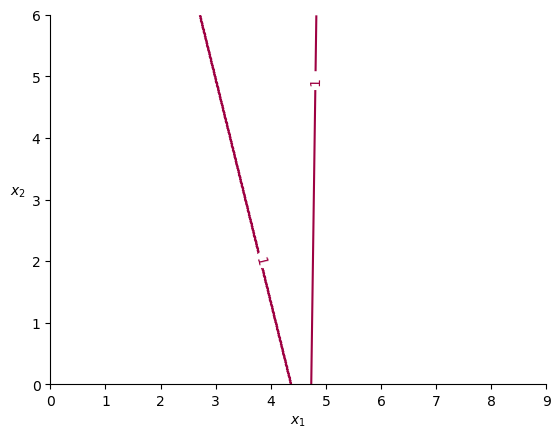
The right line represents all x where g(x) = 1
My question: why does the left line appear? It seems not to be a correct contour line, it appears to represent the discontinuity of g(x).
Source of plot:
xmin = 0
xmax = 9
ymin = 0
ymax = 6
h = 0.01

fig, ax = plt.subplots()

X = torch.arange(xmin, xmax, h)
Y = torch.arange(ymin, ymax, h)
XX, YY = torch.meshgrid(X, Y, indexing='xy')

ZZ = torch.stack([XX.ravel(), YY.ravel()], dim=1)
ZZ = g(ZZ)
ZZ = ZZ.reshape(XX.shape)
cs = ax.contour(XX, YY, ZZ, cmap=plt.cm.Spectral, levels=[1.0])
ax.clabel(cs, inline=True, fontsize=10)

ax.set_xlim(xmin, xmax)
ax.set_ylim(ymin, ymax)
ax.set_xlabel('$x_1$')
ax.yaxis.label.set(rotation='horizontal', ha='right')
ax.set_ylabel('$x_2$', labelpad=10)
ax.spines[['right', 'top']].set_visible(False)

plt.show()