Hi all,
Is it possible to create a polar plot, where the lower bound of the radius is larger than zero ?
I would like to plot an annulus.
Any pointer would be appreciated.
Thanks in advance
Nils
Hi all,
Is it possible to create a polar plot, where the lower bound of the radius is larger than zero ?
I would like to plot an annulus.
Any pointer would be appreciated.
Thanks in advance
Nils
Nils,
It appears that there is a .set_rmin() function, however, I don’t think it does what we expect it to. I can’t get an annulus, but it only plots the parts that are r >= r_min (but r_min is at the origin, and the axis labels are in the wrong places…)
Ben Root
On Wed, Aug 18, 2010 at 8:03 AM, Nils Wagner <nwagner@…878…1052…> wrote:
Hi all,
Is it possible to create a polar plot, where the lower
bound of the radius is larger than zero ?
I would like to plot an annulus.
Any pointer would be appreciated.
Thanks in advance
Nils
Ben,
Thank you for your reply.
Please can you send me your example.
Nils
On Wed, 18 Aug 2010 08:51:31 -0500 Benjamin Root <[email protected]...> wrote:
On Wed, Aug 18, 2010 at 8:03 AM, Nils Wagner > <[email protected]...>wrote:
Hi all,
Is it possible to create a polar plot, where the lower
bound of the radius is larger than zero ?
I would like to plot an annulus.Any pointer would be appreciated.
Thanks in advance
Nils
Nils,
It appears that there is a .set_rmin() function, however, I don't think it
does what we expect it to. I can't get an annulus, but it only plots the
parts that are r >= r_min (but r_min is at the origin, and the axis labels
are in the wrong places...)Ben Root
This bug (that the r-axis labels are in the wrong place) should now be
fixed in r8651. This doesn’t, unfortunately, address the original
question about annular plots.
Mike
-- Michael Droettboom
Science Software Branch
Space Telescope Science Institute
Baltimore, Maryland, USA
2010/8/18 Michael Droettboom <[email protected]...>:
This bug (that the r-axis labels are in the wrong place) should now be fixed
in r8651. This doesn't, unfortunately, address the original question about
annular plots.
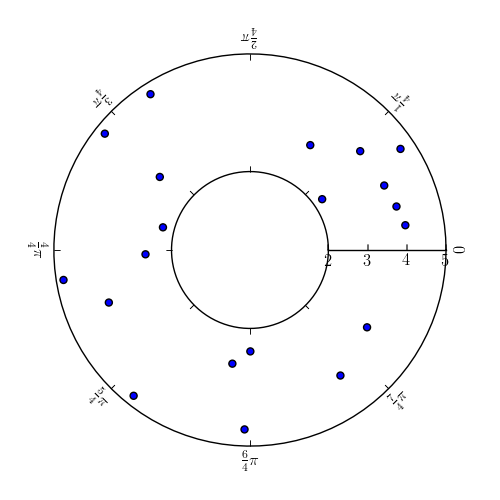
Is the attached issue with a plain polar axes already fixed? I never
encountered this before. 344 degrees happens to be 6.0 rad. I'm on
svn 8626.
polar.pdf (13.5 KB)
With mpl_toolkits.axisartist, it is possible to make an axes of annulus.
But, the resulting axes is not fully compatible with the original
matplotlib axes. Most of the tick-related commands won't work and you
need to use new commands provided by the axisartist module.
Attached is a sample script and a screeshot.
Also see these examples,
http://matplotlib.sourceforge.net/examples/axes_grid/demo_floating_axes.html
-JJ
demo_floating_axes.py (2.31 KB)
On Wed, Aug 18, 2010 at 10:03 PM, Nils Wagner <[email protected]...> wrote:
I would like to plot an annulus.
How are you creating that graph? By default, polar plots don't do that.
Mike
On 08/18/2010 06:03 PM, Friedrich Romstedt wrote:
2010/8/18 Michael Droettboom<[email protected]...>:
This bug (that the r-axis labels are in the wrong place) should now be fixed
in r8651. This doesn't, unfortunately, address the original question about
annular plots.
Is the attached issue with a plain polar axes already fixed? I never
encountered this before. 344 degrees happens to be 6.0 rad. I'm on
svn 8626.
--
Michael Droettboom
Science Software Branch
Space Telescope Science Institute
Baltimore, Maryland, USA
2010/8/19 Michael Droettboom <[email protected]...>:
Is the attached issue with a plain polar axes already fixed? I never
encountered this before. 344 degrees happens to be 6.0 rad. I'm on
svn 8626.How are you creating that graph? By default, polar plots don't do that.
Yeah, it's my issue, but I'm not happy with fixing it. Currently,
matplotlib forces the xticks (i.e., the theta ticks) to be at sensible
values via .set_xticks() and .set_xlabels() (projections/polar.py).
I'm coding a matplotlib extension package which has to clear the axes
often, but restoring the major locators, the title and stuff after
clearing. It was agnostic to the specialities of polar axes so far.
I could say, "if nothing is requested specially, treat it as a running
system", but I see this as clumsy and error-prone at all.
I would rather suggest to insert a new Locator class being aware of
radians. It would suffice to return tick positions dividing 2 pi into
an integer number of bins. It's not necessary to cover all the
peculiarities of the old historic division system into 360 parts.
Accompanying would be formatters in radians and degrees with
adjustable precision (no autodetect necessary).
Friedrich
On 08/18/2010 06:03 PM, Friedrich Romstedt wrote:
2010/8/19 Michael Droettboom<[email protected]...>:
Is the attached issue with a plain polar axes already fixed? I never
encountered this before. 344 degrees happens to be 6.0 rad. I'm on
svn 8626.
How are you creating that graph? By default, polar plots don't do that.
Yeah, it's my issue, but I'm not happy with fixing it. Currently,
matplotlib forces the xticks (i.e., the theta ticks) to be at sensible
values via .set_xticks() and .set_xlabels() (projections/polar.py).I'm coding a matplotlib extension package which has to clear the axes
often, but restoring the major locators, the title and stuff after
clearing. It was agnostic to the specialities of polar axes so far.
Why and how are you restoring the major locator? It seems like that's the issue. I don't think preventing the theta locator from being changed is something we want to do. Polar plots (by default) just set fixed theta ticks at multiples of pi/4.
I would rather suggest to insert a new Locator class being aware of
radians. It would suffice to return tick positions dividing 2 pi into
an integer number of bins. It's not necessary to cover all the
peculiarities of the old historic division system into 360 parts.
Perhaps using FixedLocator, rather than explicitly setting the ticks using set_xticks (as polar plots currently do) would be better. However, the locator could still be changed, not really addressing your problem.
For convenience, however, we could add a locator that given n, divides 2pi into n parts.
Accompanying would be formatters in radians and degrees with
adjustable precision (no autodetect necessary).
Sure. Adding a radian formatter makes sense.
Mike
On 08/19/2010 05:53 PM, Friedrich Romstedt wrote:
On 08/18/2010 06:03 PM, Friedrich Romstedt wrote:
--
Michael Droettboom
Science Software Branch
Space Telescope Science Institute
Baltimore, Maryland, USA
Just curious, this wouldn’t have to be just for PolarPlots, right? Could it also be used for regular plots of sinusoids and such.
Ben Root
On Fri, Aug 20, 2010 at 8:33 AM, Michael Droettboom <mdroe@…120…86…> wrote:
On 08/19/2010 05:53 PM, Friedrich Romstedt wrote:
2010/8/19 Michael Droettboom<mdroe@…86…>:
On 08/18/2010 06:03 PM, Friedrich Romstedt wrote:
Is the attached issue with a plain polar axes already fixed? I never
encountered this before. 344 degrees happens to be 6.0 rad. I’m on
svn 8626.
How are you creating that graph? By default, polar plots don’t do that.
Yeah, it’s my issue, but I’m not happy with fixing it. Currently,
matplotlib forces the xticks (i.e., the theta ticks) to be at sensible
values via .set_xticks() and .set_xlabels() (projections/polar.py).
I’m coding a matplotlib extension package which has to clear the axes
often, but restoring the major locators, the title and stuff after
clearing. It was agnostic to the specialities of polar axes so far.
Why and how are you restoring the major locator? It seems like that’s
the issue. I don’t think preventing the theta locator from being
changed is something we want to do. Polar plots (by default) just set
fixed theta ticks at multiples of pi/4.
I would rather suggest to insert a new Locator class being aware of
radians. It would suffice to return tick positions dividing 2 pi into
an integer number of bins. It’s not necessary to cover all the
peculiarities of the old historic division system into 360 parts.
Perhaps using FixedLocator, rather than explicitly setting the ticks
using set_xticks (as polar plots currently do) would be better.
However, the locator could still be changed, not really addressing your
problem.
For convenience, however, we could add a locator that given n, divides
2pi into n parts.
Accompanying would be formatters in radians and degrees with
adjustable precision (no autodetect necessary).
Sure. Adding a radian formatter makes sense.
2010/8/20 Michael Droettboom <[email protected]...>:
Yeah, it's my issue, but I'm not happy with fixing it. Currently,
matplotlib forces the xticks (i.e., the theta ticks) to be at sensible
values via .set_xticks() and .set_xlabels() (projections/polar.py).I'm coding a matplotlib extension package which has to clear the axes
often, but restoring the major locators, the title and stuff after
clearing. It was agnostic to the specialities of polar axes so far.Why and how are you restoring the major locator? It seems like that's the
issue. I don't think preventing the theta locator from being changed is
something we want to do. Polar plots (by default) just set fixed theta
ticks at multiples of pi/4.
My package provides support for Layers in matplotlib. And the layers'
data can be changed, making a complete redraw of the axes a solution
much easier to implement than dealing with the fuzzy API stuff
directly. I don't need high-performance.
When putting axes.clear(), the locator is being reset. In cartesian
coords, it happens that I want a MaxNLocator(nbins=3) or similiar from
time to time, and this must be restored then. For cartesian axes, if
the user does not specify another locator, I'm setting the
AutoLocator(), what is the same what the (cartesian) axes does.
Dealing with the case "no locator set" (by "using matplotlib default
fallback") is neither nice nor straightforward. (It has to do with
complicating the calling conventions. I would have to treat the case
'ignore [x|y]locator' specially.)
It would maybe be a good solution to provide some abstract
Axes.get_default_locators(), being public. Each SomeClass(Axes) can
define what they understand under "default locator".
I would rather suggest to insert a new Locator class being aware of
radians. It would suffice to return tick positions dividing 2 pi into
an integer number of bins. It's not necessary to cover all the
peculiarities of the old historic division system into 360 parts.Perhaps using FixedLocator, rather than explicitly setting the ticks using
set_xticks (as polar plots currently do) would be better. However, the
locator could still be changed, not really addressing your problem.
Seems that you misunderstood my problem, if I'm not misunderstanding
you ![]() I have no problem with a "mutable" locator. (But the user
I have no problem with a "mutable" locator. (But the user
has normally no access to the axes, only the Stack class changes the
axes.)
But right, I wanted to derive it from the Locator class framework,
just specialising the location.
For convenience, however, we could add a locator that given n, divides 2pi
into n parts.
Yes, and Ben's idea is quite nice, to make this accessible also to
rectangular plots. This implies some simple thoughts on the view lims
to take them into account when issuing the tick locations.
Accompanying would be formatters in radians and degrees with
adjustable precision (no autodetect necessary).Sure. Adding a radian formatter makes sense.
If we go into details let's switch to -devel maybe?
Friedrich