Hi all,
I’m trying to plot some radar data I’m working on, which is presented as a 2048x1440 2D array of ints. This means 2048 azimuth angle values between 0° and 360°, and 1440 range increments. Array values represent signal return in that angle/range coordinate. Due to hardware problems, some angle ranges are missing, there the signal value is zero in the grid.
The obvious way of plotting this would be a polar grid, so I used a pcolormesh, like this:
*import numpy as np
import matplotlib.pyplot as plt
···
plt.ion()
fig = plt.figure()
ax = fig.add_subplot(111, projection=‘polar’)
theta,rad = np.meshgrid(np.arange(0., 360., 360./scan.shape[0]), np.arange(scan.shape[1]))
ax.pcolormesh(theta, rad, scan.T)
plt.draw()
I transposed scan because theta and rad are 1440x2048 arrays, where scan is a 2048x1440 array.
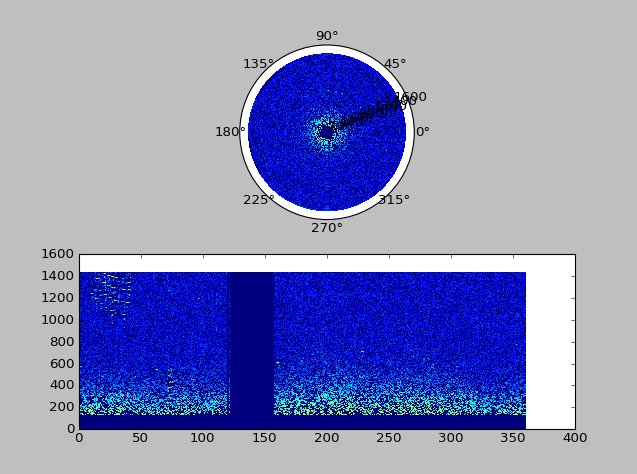
The resulting image seemed ok, but there were no gaps, which I knew were there, so I ran the same code without the ‘polar’ option, and put them side to side. The result is this:
In the rectangular plot, there is a gap between around 120° to 160°, which should be an empty wedge in the polar plot, but it isn’t there. Same for the obvious echos at long range between 0° and 50°. OTOH the plot seems quite right, with the gating gap around the radar station in the center and the stronger echos at short range.
So I’m a bit baffled as to why this doesn’t work the way it should. Does anyone here have an explanation?
–
Alex Borghgraef