Dear All,
I am having a hard time with something which must be fairly doable: I
would like to plot a simple scalar function on a circular domain.
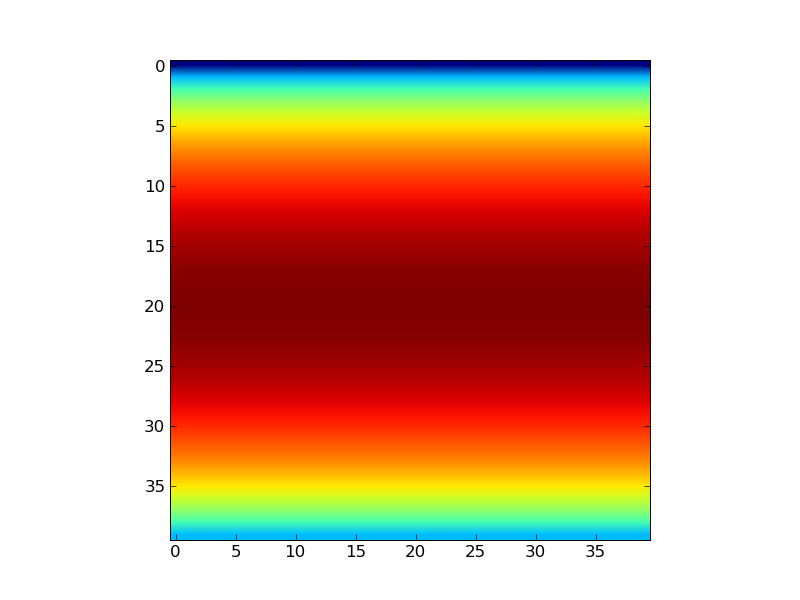
Consider for instance a trivial modification of one of the online examples:
Code 1
#!/usr/bin/env python
"""
See pcolor_demo2 for a much faster way of generating pcolor plots
"""
from __future__ import division
from pylab import *
def func3(x,y):
return (1- x/2 + x**5 + y**3)*exp(-x**2-y**2)
def func4(x,y):
theta=arcsin(y)
return cos(theta)
# make these smaller to increase the resolution
dx, dy = 0.05, 0.05
x = arange(-1.0, 1.0, dx)
y = arange(-1.0, 1.0, dy)
X,Y = meshgrid(x, y)
Z = func4(X, Y)
print "Z is, ", Z
ax = subplot(111)
im = imshow(Z, cmap=cm.jet)
#im.set_interpolation('nearest')
#im.set_interpolation('bicubic')
im.set_interpolation('bilinear')
#ax.set_image_extent(-3, 3, -3, 3)
show()
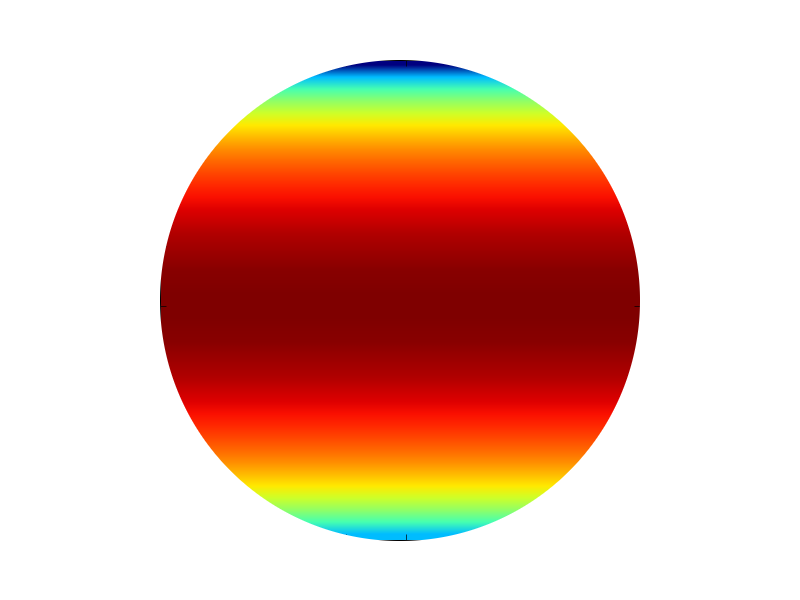
Now, I would like to plot exactly the same function but on a circular
domain (circle of radius 1 centered at (0,0)).
What is the easiest way of doing that? Some time ago I came across a
similar problem (again, plotting a scalar on a circular domain) and I
came up with this code (thanks to the help I got from the list)
Code 2
#! /usr/bin/env python
from scipy import *
import pylab
import numpy
nt=20
nr=20
r=linspace(0.,10.,nr)
theta=linspace(0.,2.*pi,nt)
#print "theta is ", theta
sin_t=sin(theta)
cos_t=cos(theta)
rsin_t=r[newaxis,:]*sin_t[:,newaxis]
rcos_t=r[newaxis,:]*cos_t[:,newaxis]
rsin_t=ravel(rsin_t)
rcos_t=ravel(rcos_t)
rsin_t.shape=(nt,nr)
rcos_t.shape=(nt,nr)
vel_section=numpy.random.normal(0.,5.,(nr*nt))
vel_section=reshape(vel_section,(nt,nr))
print 'OK up to here'
#pylab.colorbar()
#pylab.clf()
pylab.figure()
X = rsin_t.transpose()
Y = rcos_t.transpose()
Z = vel_section.transpose()
velmin = vel_section.min()
velmax = vel_section.max()
print velmin, velmax
levels = arange(velmin, velmax+0.01, 0.1)
pylab.contourf(X, Y, Z, levels, cmap=pylab.cm.jet)
pylab.colorbar()
pylab.show()
pylab.savefig("velocity_on_section_DNS")
#pylab.hold(False)
but I have been unable to modify it according to my present needs.
I am not really finding my way through the documentation/examples for
some details (for instance, I am not sure about how to include a
discrete colorbar ranging from 0 to 1 in steps of 0.1 in code 1), but
at the moment this is secondary probably.
Any suggestion is welcome.
Many thanks
Lorenzo
···
--
Life is what happens to you while you're busy making other plans.