To all:
I'm wondering if there is any way to make plots with open symbols, e.g.
a circle. I know how to use markers that look open, e.g. by doing
something like,
plot(x,y,marker='o',mfc='w')
They are white in the center, but they're not really open since they
block out whatever is behind them. I tried using a color with
transparency, say alpha=0.1 or something (mfc=(1.,1.,1.,0.1)) but that
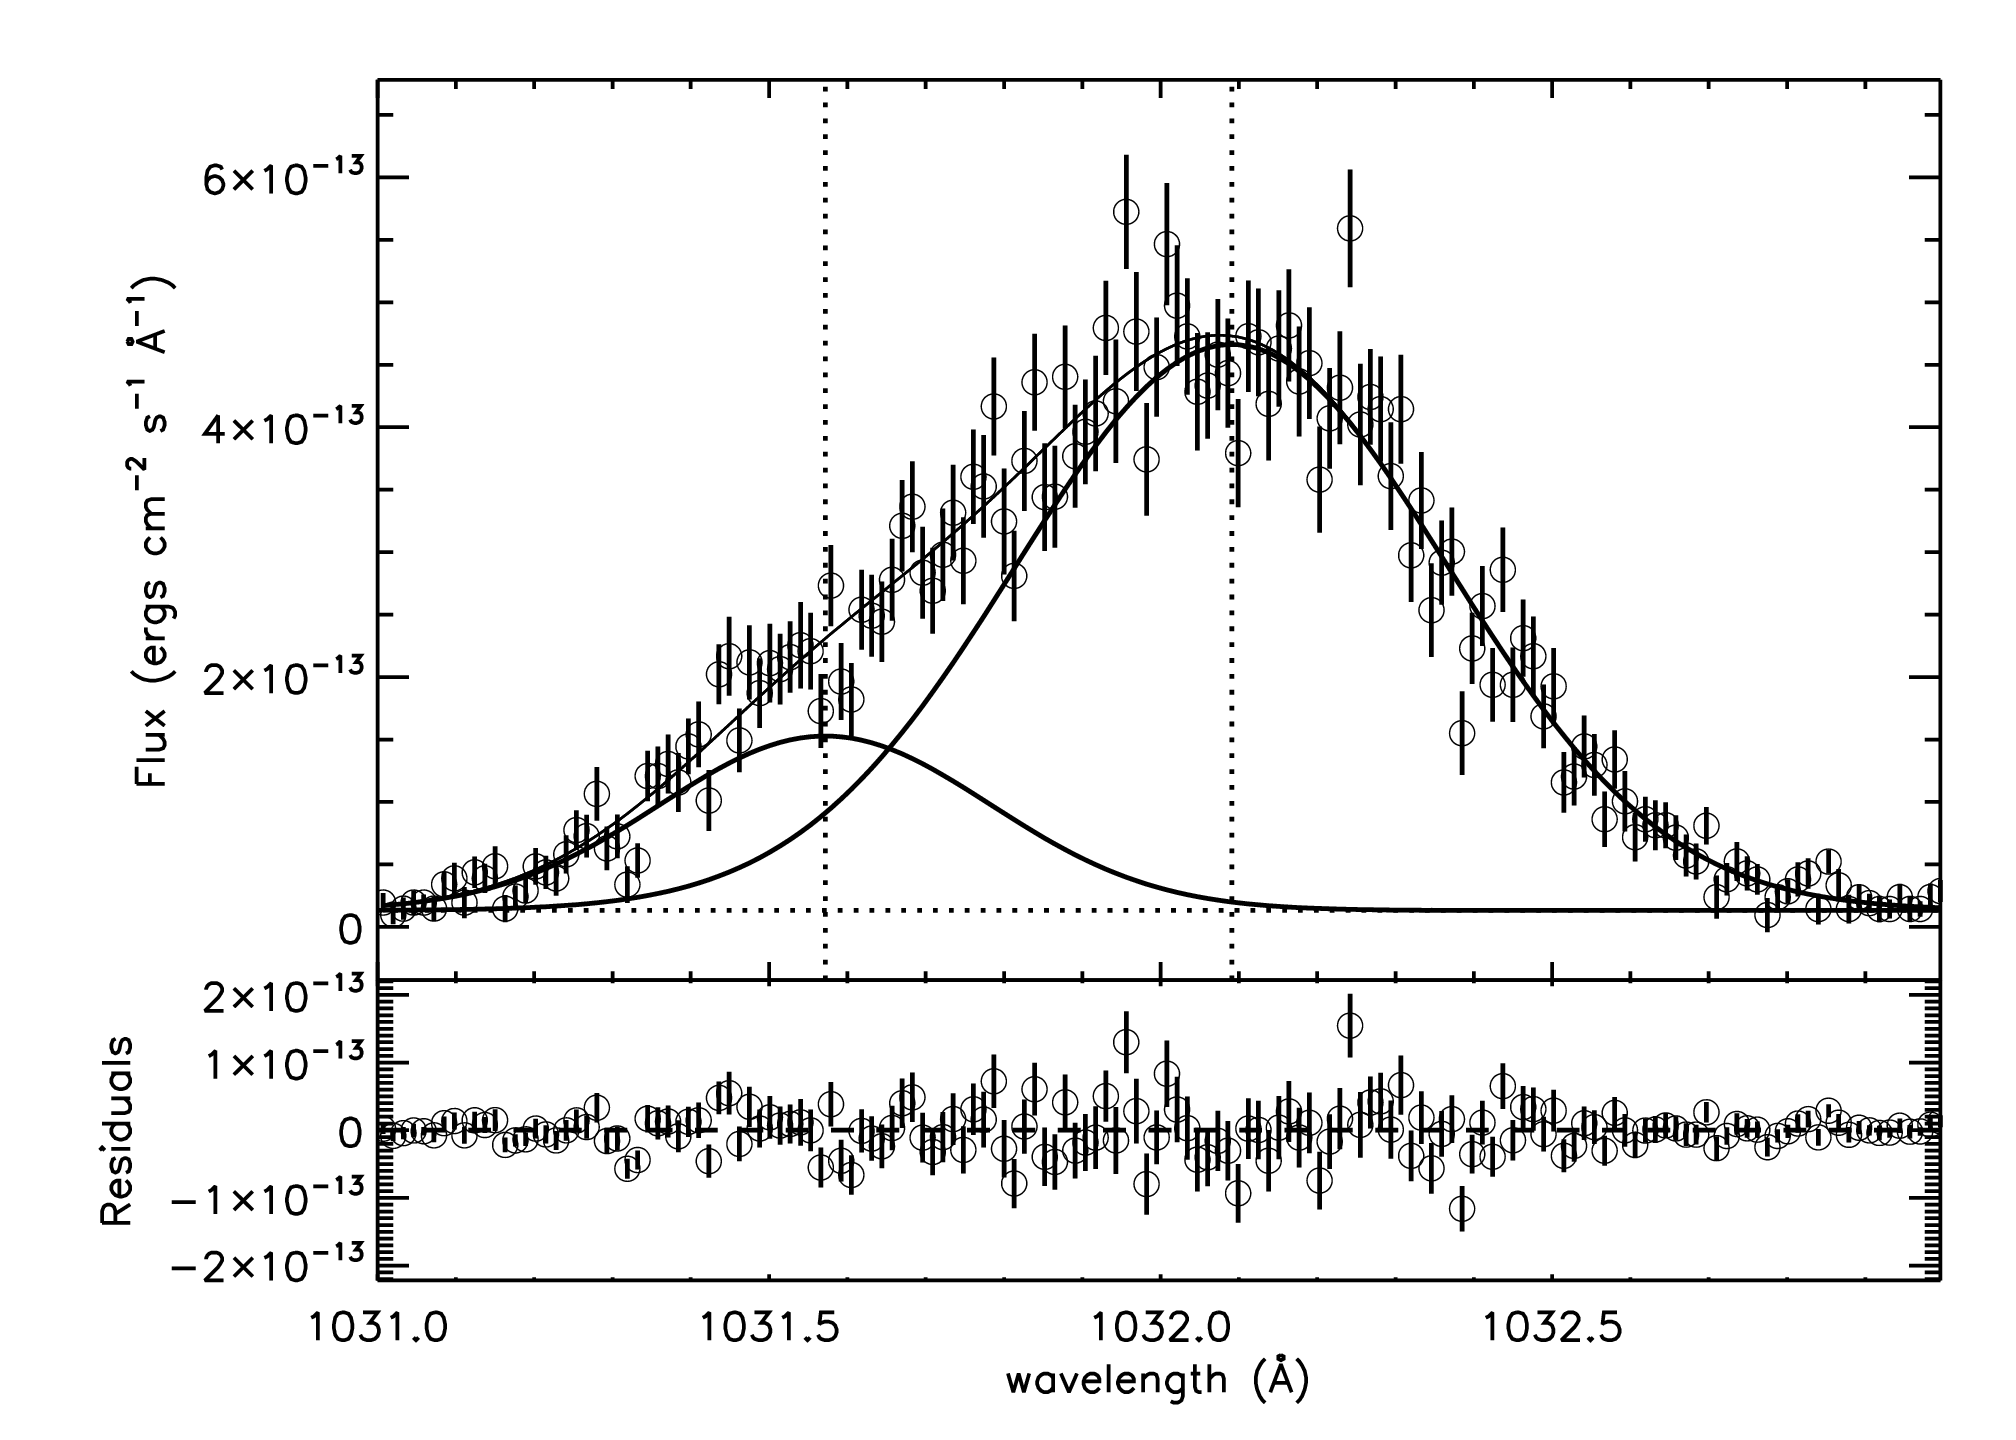
didn't work. What I have in mind is illustrated in the attached plot,
which I made some time ago in IDL. Is there an easy way to define your
own markers for plotting?
Jon
Tinne,
Thanks. I think I had tried that but with mfc=None -- that is without
None in quotes as if it were a string. I have to say it's a bit odd to
have it in quotes since generally it is a different data type entirely
(None type).
Jon
···
On Fri, 2010-08-20 at 17:12 +0200, Tinne De Laet wrote:
Hi Jonathan,
On Fri, Aug 20, 2010 at 16:29, Jonathan Slavin <[email protected]...> wrote:
> To all:
>
> I'm wondering if there is any way to make plots with open symbols, e.g.
> a circle. I know how to use markers that look open, e.g. by doing
> something like,
> plot(x,y,marker='o',mfc='w')
> They are white in the center, but they're not really open since they
> block out whatever is behind them. I tried using a color with
> transparency, say alpha=0.1 or something (mfc=(1.,1.,1.,0.1)) but that
> didn't work. What I have in mind is illustrated in the attached plot,
> which I made some time ago in IDL. Is there an easy way to define your
> own markers for plotting?
just use mfc='None'
Tinne
--
______________________________________________________________
Jonathan D. Slavin Harvard-Smithsonian CfA
[email protected]... 60 Garden Street, MS 83
phone: (617) 496-7981 Cambridge, MA 02138-1516
cell: (781) 363-0035 USA
______________________________________________________________
John,
This used to trip me up as well. However, for colors in matplotlib, None (without quotes) tells mpl to use the default color, while ‘None’ (typically not case-sensitive) means “do not plot any color”.
I hope that clears things up.
Ben Root
···
On Fri, Aug 20, 2010 at 10:25 AM, Jonathan Slavin <jslavin@…1081…> wrote:
Tinne,
Thanks. I think I had tried that but with mfc=None – that is without
None in quotes as if it were a string. I have to say it’s a bit odd to
have it in quotes since generally it is a different data type entirely
(None type).
Jon
On Fri, 2010-08-20 at 17:12 +0200, Tinne De Laet wrote:
Hi Jonathan,
On Fri, Aug 20, 2010 at 16:29, Jonathan Slavin <jslavin@…1081…> wrote:
To all:
I’m wondering if there is any way to make plots with open symbols, e.g.
a circle. I know how to use markers that look open, e.g. by doing
something like,
plot(x,y,marker=‘o’,mfc=‘w’)
They are white in the center, but they’re not really open since they
block out whatever is behind them. I tried using a color with
transparency, say alpha=0.1 or something (mfc=(1.,1.,1.,0.1)) but that
didn’t work. What I have in mind is illustrated in the attached plot,
which I made some time ago in IDL. Is there an easy way to define your
own markers for plotting?
just use mfc=‘None’
Tinne
–
2010/8/20 Benjamin Root <[email protected]...>:
This used to trip me up as well. However, for colors in matplotlib, None
(without quotes) tells mpl to use the default color, while 'None' (typically
not case-sensitive) means "do not plot any color".
More precise, the string 'None' translates to fully transparent black,
as far as I understand. The ps backend e.g. ignores such objects when
printing out then.
Freidrich