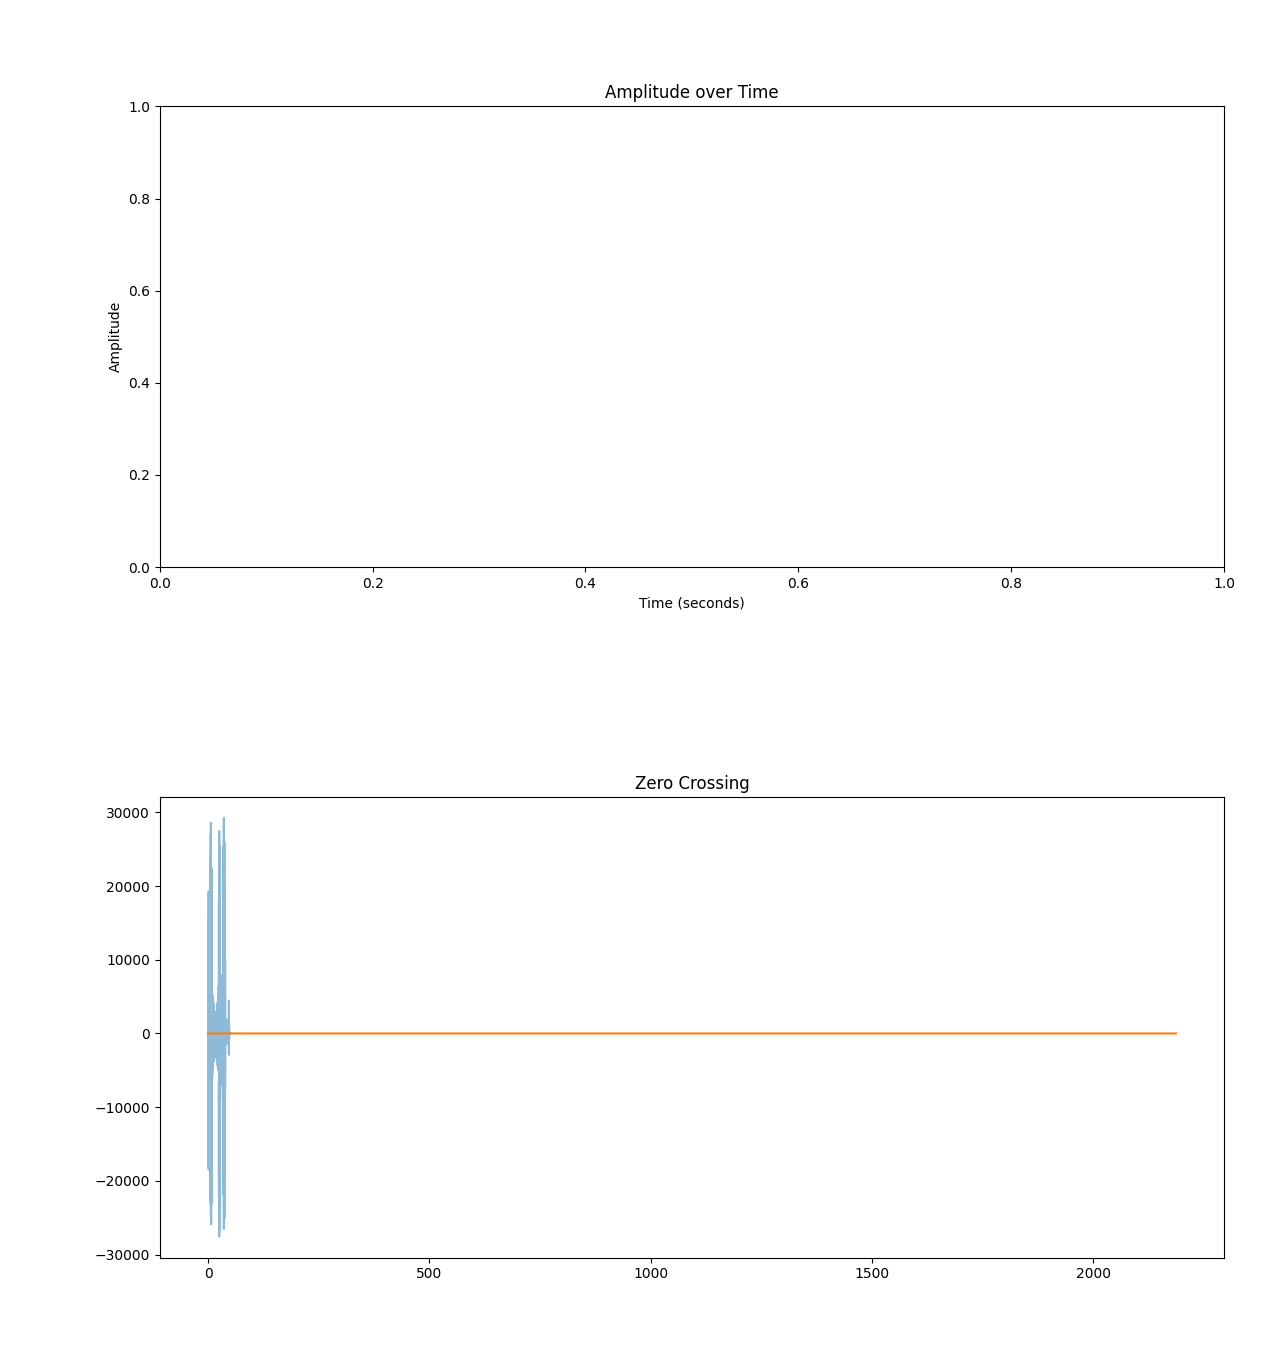
I am doing something really simple, which is to plot amplitude over time in one subplot and zero crossing on another subplot. When I try to plot amplitude over time, it gets mounted on top of the zero crossing plot, no matter what I do. If I plot the zero crossing and something else, it works correctly.
This is really strange behavior and I have never seen it before. Is there a solution to this or it’s a bug ?
Thanks
class AudioFeaturesPLotter:
    def __init__(self, subplots) -> None:
        self.fig, self.axs = plt.subplots(subplots)

    def get_axes(self):
        return self.axs

    def plot_axes(self):
        plt.tight_layout()
        plt.show()
class AudioAmplitudeOverTime:
    def __init__(self, time_sf, soundwave_sf, axs) -> None:
        self.time_sf = time_sf
        self.soundwave_sf = soundwave_sf
        self.axs = axs
        # amplitude of audio over time
        self.axs[0].set_title('Amplitude over Time')
        self.axs[0].set_ylabel('Amplitude')
        self.axs[0].set_xlabel('Time (seconds)')
        # Add the audio data to the plot
        self.axs[0] = plt.plot(self.time_sf, self.soundwave_sf, alpha=0.5)


class ZeroCrossingRate:
    def __init__(self, x, axs) -> None:
        # zero crossing rate
        self.axs = axs
        self.x = x
        self.zcrs = librosa.feature.zero_crossing_rate(self.x)
        self.axs[1].set_title("Zero Crossing")
        self.axs[1] = plt.plot(self.zcrs[0])
plot = AudioFeaturesPLotter(2)

axs = plot.get_axes()

wave = WaveLoader(file)

librowave = LibrosaFileLoader(file)

amplitude = AudioAmplitudeOverTime(wave.time_sf,wave.soundwave_sf,axs)

zerocrossing = ZeroCrossingRate(librowave.x,axs)

plot.plot_axes()
Amplitude over time and zero crossing ( as in the code posted )
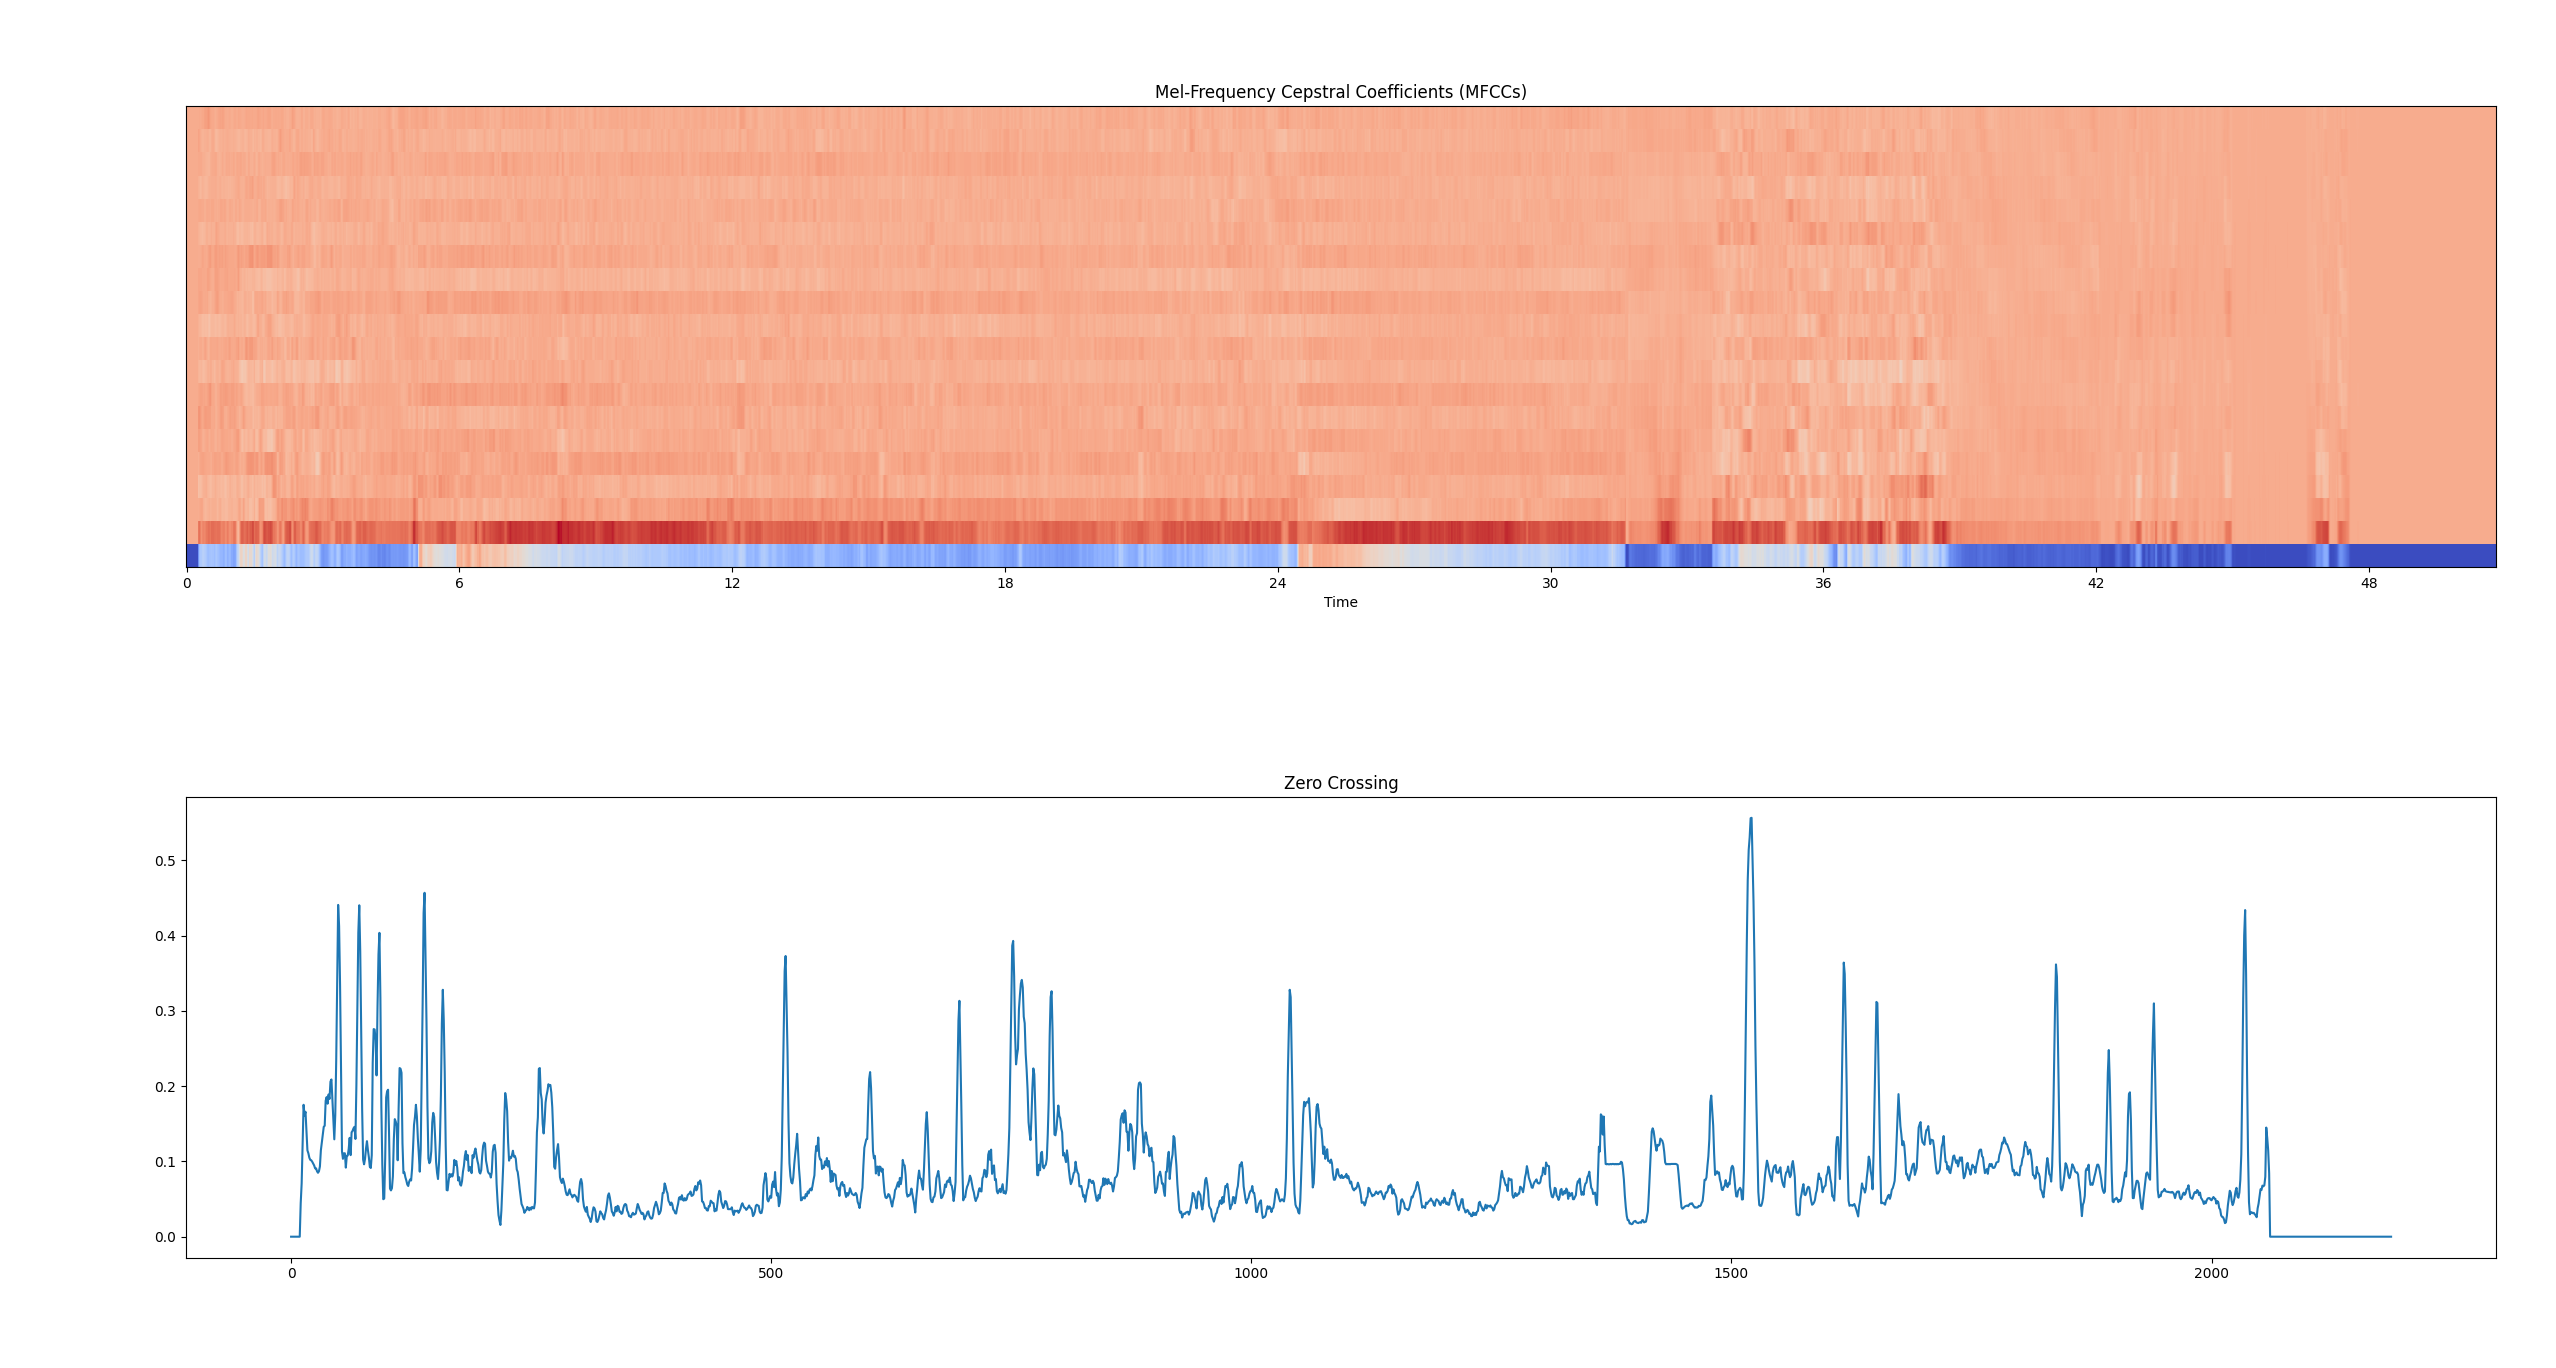
Zero crossing and something else ( works correctly )