Hi all. I would like to plot 3D visualisations (bars, contours, etc) on top of a 3D surface.
In my case, the surface is a football pitch, but I have heavily simplified the code to just show a green surface (where all z-values are 0) and some 3D bars which all shoot upwards from z=0.
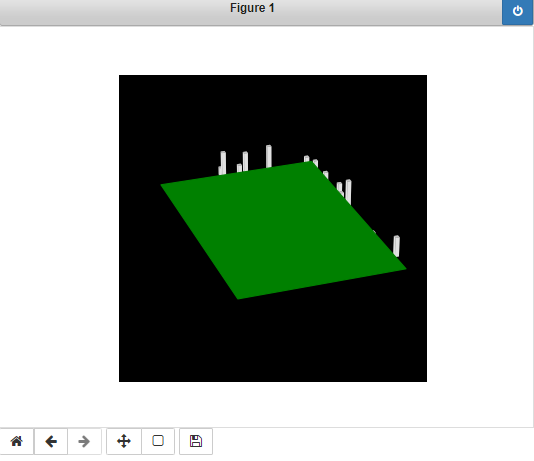
The problem: the bars are invisible from most angles, as Matplotlib is prioritising the surface/collection over the bars (apologies if I’m mixing up technical terms!). I have tried playing around with zorder values, but to no avail.
After a lot of googling, I eventually found an FAQ page which appears to confirm my fear that what I want to achieve is not yet possible in Matplotlib, but as I have invested so much time and effort into this project and was otherwise extremely happy with how the finished product was looking: is there any way this can be done? Thanks so much for any responses ![]()
-
Simplified code is below, along with an image showing only a portion of the bars that are near the edge, when there should be more. I tried attaching another image but as a new user it won’t let me.
-
What the real thing would normally look like is here, for those that are interested! https://twitter.com/DymondFormation/status/1361367676451487745
import numpy as np
import matplotlib.pyplot as plt
import mpl_toolkits.mplot3d.art3d as art3d
%matplotlib notebook
fig = plt.figure()
ax = fig.gca(projection=‘3d’)
ax.set_facecolor(‘black’)
plotting a surface
grass_x = [-40, -40, 40, 40]
grass_y = [-60, 60, 60, -60]
grass_z = [0, 0, 0, 0]
grass_verts = [list(zip(grass_x, grass_y, grass_z))]
grass = art3d.Poly3DCollection(grass_verts, color=‘green’, lw=1, alpha=1, zorder=1)
ax.add_collection3d(grass, zs=grass_z)
plotting 50 bars in random places
num = 50
x = np.random.uniform(low=-40, high=40, size=(num,))
y = np.random.uniform(low=-60, high=60, size=(num,))
z = [0]*num
dx = [2]*num
dy = [2]*num
dz = np.random.uniform(low=0.3, high=5, size=(num,))
ax.bar3d(x, y, z, dx, dy, dz, shade=True, zorder=200, color=‘white’)
ax.set_xlim(-45, 45)
ax.set_ylim(-45, 45)
ax.set_zlim(-10, 10)
ax.set_axis_off()