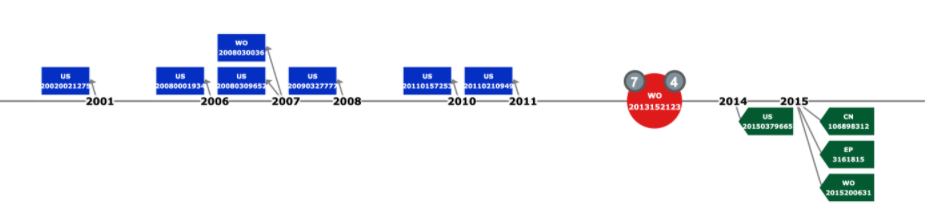
Hi, I have been trying to plot a timeline citation graph using matplotlib (similar to the image attached below), but not sure how to start. Does anyone have any idea how to create this type of chart?
See this example, perhaps:
https://matplotlib.org/stable/gallery/lines_bars_and_markers/timeline.html