Hi
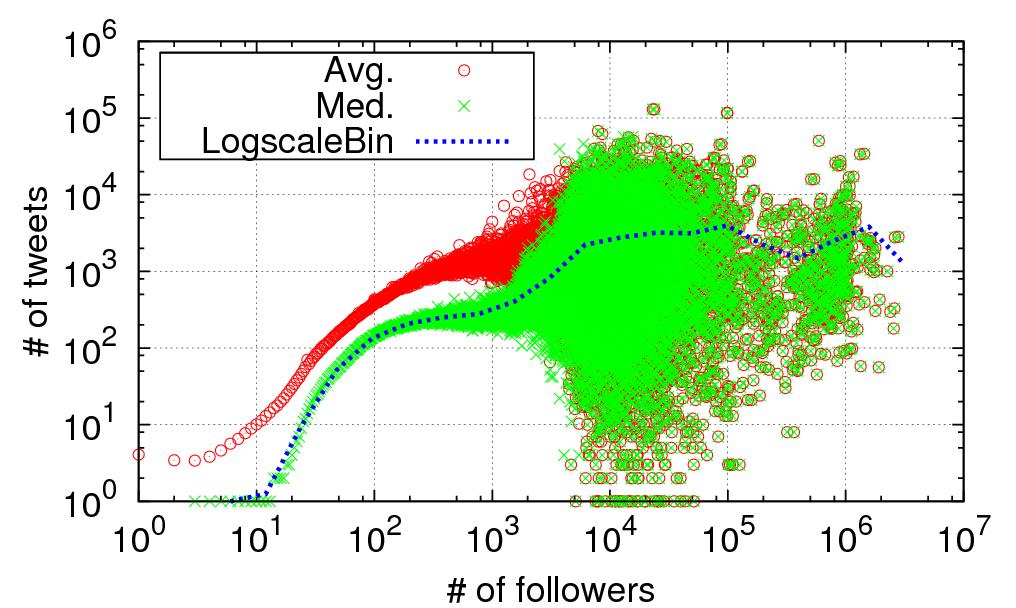
i want to plot a scatter plot similar to the one attached with email . I can plot a histogram but the hist method can’t plot a scatter plot . Is there a way to use the output of the hist() method and use it as an input to the scatter plot ?
The part of the code i am using to plot histogram is as follows :
data = get_data()
plt.figure(figsize=(7,4))
ax = plt.subplots()
plt.hist(data,histtype='bar',bins = 100,log=True)

plt.show()
Thanks
Dilpreet
Dilpreet,
Fortunately, you have a couple of options here. First of all, when you call the plt.hist function, it actually returns three useful sets of data: the frequencies, bin edges, and the bar patches. The first two are probably what you want. You can grab those for later use in your code by doing the following:
freq, bins, bars = plt.hist(data,histtype=‘bar’,bins = 100,log=True)
It will be a little tricky here because the ‘bins’ array are the edges of the bins that contain the frequency values, so there will be one more value than the ‘freq’ array. You can quickly calculate the center of the bins by taking the average of each bin pair:
(bins[1:] + bins[:-1])/2.
Alternatively, if you don’t want to actually plot the histogram but just the freq and bins arrays, then you can use the ‘histogram’ function in Numpy, which I believe is used internally by Matplotlib.
http://docs.scipy.org/doc/numpy/reference/generated/numpy.histogram.html
Ryan
···
On Mon, Aug 19, 2013 at 7:27 PM, dilpreet singh <giggs102@…120…287…> wrote:
Hi
i want to plot a scatter plot similar to the one attached with email . I can plot a histogram but the hist method can’t plot a scatter plot . Is there a way to use the output of the hist() method and use it as an input to the scatter plot ?
The part of the code i am using to plot histogram is as follows :
data = get_data()
plt.figure(figsize=(7,4))
ax = plt.subplots()
plt.hist(data,histtype='bar',bins = 100,log=True)


plt.show()
Thanks
Dilpreet
Introducing Performance Central, a new site from SourceForge and
AppDynamics. Performance Central is your source for news, insights,
analysis and resources for efficient Application Performance Management.
Visit us today!
http://pubads.g.doubleclick.net/gampad/clk?id=48897511&iu=/4140/ostg.clktrk
Matplotlib-users mailing list
[email protected]
https://lists.sourceforge.net/lists/listinfo/matplotlib-users
Perhaps hexbin() is what you are looking for?
Cheers!
Ben Root
···
On Aug 19, 2013 7:29 PM, “dilpreet singh” <giggs102@…287…> wrote:
Hi
i want to plot a scatter plot similar to the one attached with email . I can plot a histogram but the hist method can’t plot a scatter plot . Is there a way to use the output of the hist() method and use it as an input to the scatter plot ?
The part of the code i am using to plot histogram is as follows :
data = get_data()
plt.figure(figsize=(7,4))
ax = plt.subplots()
plt.hist(data,histtype='bar',bins = 100,log=True)


plt.show()
Thanks
Dilpreet
Introducing Performance Central, a new site from SourceForge and
AppDynamics. Performance Central is your source for news, insights,
analysis and resources for efficient Application Performance Management.
Visit us today!
http://pubads.g.doubleclick.net/gampad/clk?id=48897511&iu=/4140/ostg.clktrk
Matplotlib-users mailing list
[email protected]
https://lists.sourceforge.net/lists/listinfo/matplotlib-users