Hello,
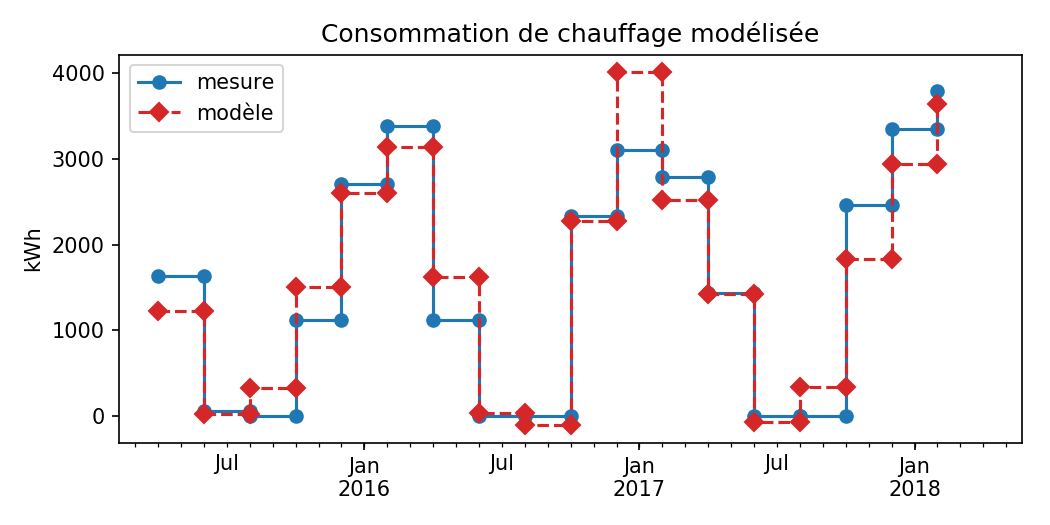
I have noticed a change with line plots using drawstyle='steps-post' and
markers.
Using Matplotlib 2.2.2 (Conso_gaz_model.png) there is a marker at each
"edge" of the line. In a previous Matplotlib version (2.1 or 2.0, cf.
file Conso_gaz_model (copie).png), there was only a marker at the actual
data point.
Is this a well-known change or a regression ? (I've quickly looked at
the issue tracker, but didn't find something)
Best,
Pierre
-------------- next part --------------
A non-text attachment was scrubbed...
Name: Conso_gaz_model.png
Type: image/png
Size: 46262 bytes
Desc: not available
URL: <http://mail.python.org/pipermail/matplotlib-devel/attachments/20180411/8fbc1b02/attachment-0002.png>
-------------- next part --------------
A non-text attachment was scrubbed...
Name: Conso_gaz_model (copie).png
Type: image/png
Size: 49402 bytes
Desc: not available
URL: <http://mail.python.org/pipermail/matplotlib-devel/attachments/20180411/8fbc1b02/attachment-0003.png>
Can you please create a bug report for that? This is an unintentional
change related to simplifying some internal implementation details.
For now I suggest plotting your data twice: once with step and once with
just markers which should work on all versions of Matplotlib.
Tom
···
On Wed, Apr 11, 2018 at 4:08 PM Pierre Haessig <pierre.haessig at crans.org> wrote:
Hello,
I have noticed a change with line plots using drawstyle='steps-post' and
markers.
Using Matplotlib 2.2.2 (Conso_gaz_model.png) there is a marker at each
"edge" of the line. In a previous Matplotlib version (2.1 or 2.0, cf.
file Conso_gaz_model (copie).png), there was only a marker at the actual
data point.
Is this a well-known change or a regression ? (I've quickly looked at
the issue tracker, but didn't find something)
Best,
Pierre
_______________________________________________
Matplotlib-devel mailing list
Matplotlib-devel at python.org
Matplotlib-devel Info Page
-------------- next part --------------
An HTML attachment was scrubbed...
URL: <http://mail.python.org/pipermail/matplotlib-devel/attachments/20180411/84e0a87e/attachment.html>
Thanks for the feedback. Here is the bug report
wrong x-position of marker with drawstyle='steps-xxx' · Issue #11031 · matplotlib/matplotlib · GitHub "wrong x-position
of marker with drawstyle='steps-xxx'". I hope the title is appropriate.
Is there a unit test for plots with drawstyle='steps-xxx' ?
Best,
Pierre
Le 11/04/2018 ? 22:12, Thomas Caswell a ?crit?:
Can you please create a bug report for that?? This is an unintentional
change related to simplifying some internal implementation details.
For now I suggest plotting your data twice: once with step and once
with just markers which should work on all versions of Matplotlib.
Tom
Hello,
I have noticed a change with line plots using
drawstyle='steps-post' and
markers.
Using Matplotlib 2.2.2 (Conso_gaz_model.png) there is a marker at
each
"edge" of the line. In a previous Matplotlib version (2.1 or 2.0, cf.
file Conso_gaz_model (copie).png), there was only a marker at the
actual
data point.
Is this a well-known change or a regression ? (I've quickly looked at
the issue tracker, but didn't find something)
-------------- next part --------------
An HTML attachment was scrubbed...
URL: <http://mail.python.org/pipermail/matplotlib-devel/attachments/20180412/b8800e7a/attachment.html>
···
On Wed, Apr 11, 2018 at 4:08 PM Pierre Haessig > <pierre.haessig at crans.org <mailto:pierre.haessig at crans.org>> wrote:
Thanks.
There are unit tests for step, but not with markers.
···
On Thu, Apr 12, 2018, 03:25 Pierre Haessig <pierre.haessig at crans.org> wrote:
Thanks for the feedback. Here is the bug report
wrong x-position of marker with drawstyle='steps-xxx' · Issue #11031 · matplotlib/matplotlib · GitHub "wrong x-position
of marker with drawstyle='steps-xxx'". I hope the title is appropriate.
Is there a unit test for plots with drawstyle='steps-xxx' ?
Best,
Pierre
Le 11/04/2018 ? 22:12, Thomas Caswell a ?crit :
Can you please create a bug report for that? This is an unintentional
change related to simplifying some internal implementation details.
For now I suggest plotting your data twice: once with step and once with
just markers which should work on all versions of Matplotlib.
Tom
On Wed, Apr 11, 2018 at 4:08 PM Pierre Haessig <pierre.haessig at crans.org> > wrote:
Hello,
I have noticed a change with line plots using drawstyle='steps-post' and
markers.
Using Matplotlib 2.2.2 (Conso_gaz_model.png) there is a marker at each
"edge" of the line. In a previous Matplotlib version (2.1 or 2.0, cf.
file Conso_gaz_model (copie).png), there was only a marker at the actual
data point.
Is this a well-known change or a regression ? (I've quickly looked at
the issue tracker, but didn't find something)
-------------- next part --------------
An HTML attachment was scrubbed...
URL: <http://mail.python.org/pipermail/matplotlib-devel/attachments/20180412/a0b0f5b6/attachment.html>