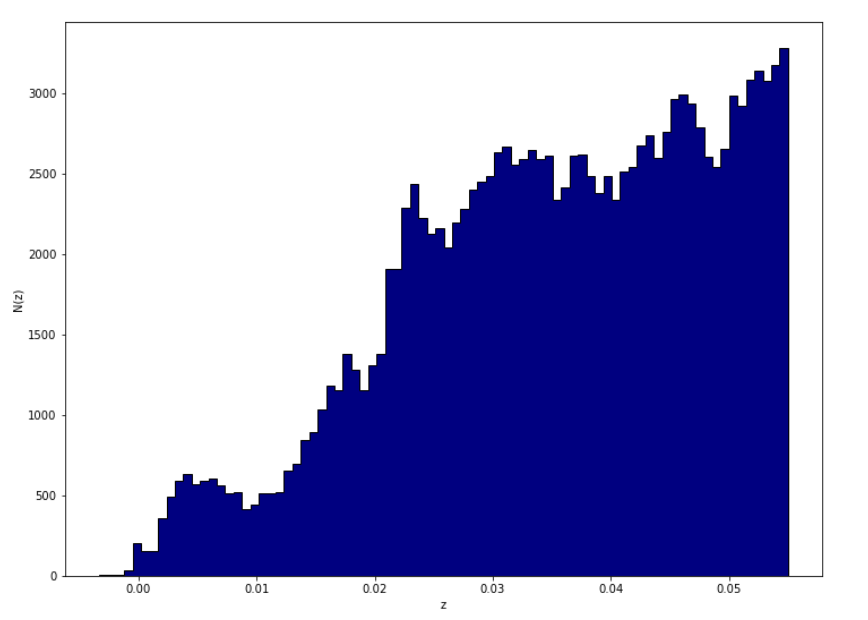
I was able to get the “jet” color map working with my scatter plot, but not with my histogram. Could someone with fresh eyes tell me what I’m doing wrong? Thanks in advance.
import numpy as np
from matplotlib import pyplot as plt
from astropy.visualization import hist
from astroML.datasets import fetch_nasa_atlas
data = fetch_nasa_atlas()
#------------------------------------------------------------
# plot the RA/DEC in an area-preserving projection
RA = data['RA']
DEC = data['DEC']
# convert coordinates to degrees
RA -= 180
RA *= np.pi / 180
DEC *= np.pi / 180
ax = plt.axes(projection='mollweide')
plt.scatter(RA, DEC, s=1, c=data['Z'], cmap=plt.cm.jet,
edgecolors='none', linewidths=0)
plt.grid(True)
plt.title('NASA Atlas Galaxy Locations')
cb = plt.colorbar(cax=plt.axes([0.05, 0.1, 0.9, 0.05]),
orientation='horizontal',
ticks=np.linspace(0, 0.05, 6))
cb.set_label('redshift')
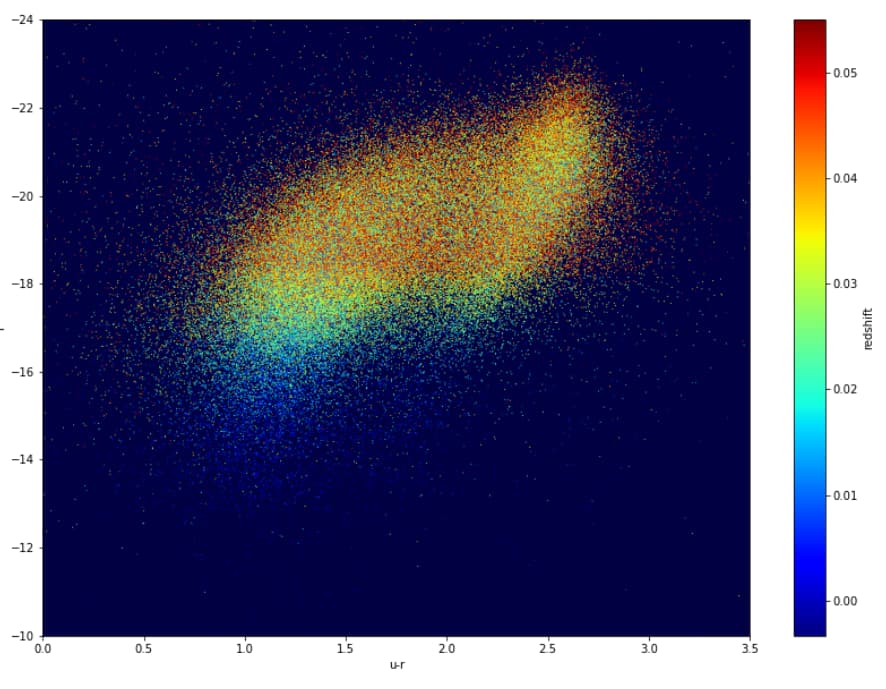
#------------------------------------------------------------
# plot the r vs u-r color-magnitude diagram
absmag = data['ABSMAG']
u = absmag[:, 2]
r = absmag[:, 4]
plt.figure(figsize=(14,10))
#plt.figure()
ax = plt.axes(facecolor='#000042')
plt.scatter(u - r, r, s=1, lw=0, c=data['Z'], cmap=plt.cm.jet)
plt.colorbar(ticks=np.linspace(0, 0.05, 6)).set_label('redshift')
plt.xlim(0, 3.5)
plt.ylim(-10, -24)
plt.xlabel('u-r')
plt.ylabel('r')
#------------------------------------------------------------
# plot a histogram of the redshift
# This is the colormap I'd like to use.
cm = plt.cm.get_cmap('jet')
plt.figure(figsize=(12,9))
n, bins, patches = hist(data['Z'], bins='knuth', histtype='stepfilled', ec='k')
plt.xlabel('z')
plt.ylabel('N(z)')
#print("n: ", n, "\n\nbins: ", bins, "\n\npatches: ", patches)
# https://www.tutorialspoint.com/plot-a-histogram-with-colors-taken-from-colormap-in-matplotlib
col = (n-n.min())/(n.max()-n.min())
#print("\ncols: ", col)
for c, p in zip(col, patches):
plt.setp(p, 'facecolor', cm(c))
plt.show()