Hi,
I have a set of vertices in 2D as triples (x, y, val), where the x, y
are 2D coordinates and "val" is the scalar value of the finite element
solution, here is an example:
In [54]: l.get_vertices()
Out[54]:
array([[ 0.00000000e+00, -1.00000000e+00, -2.22396971e-17],
[ 1.00000000e+00, -1.00000000e+00, -1.64798730e-17],
[ -1.00000000e+00, 0.00000000e+00, 8.09899023e-17],
...,
[ 1.48437500e-01, -1.56250000e-02, 1.62359362e-01],
[ 1.32812500e-01, 0.00000000e+00, 1.56012622e-01],
[ 1.32812500e-01, -1.56250000e-02, 1.50562411e-01]])
and I also have a set of triangles that connect those points, here is
an example:
In [55]: l.get_triangles()
Out[55]:
array([[ 3, 5448, 29],
[ 27, 5445, 28],
[ 29, 28, 26],
...,
[5499, 5498, 5479],
[5510, 5493, 5491],
[5513, 5508, 5491]], dtype=int32)
The triangles define the 2D domain. What is the best way to get this
plotted with mpl? Should I write a loop using the "plot" command, or
is there a better alternative? So far, I am using the contour command
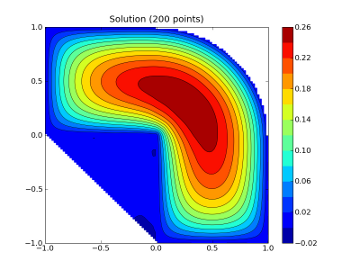
and I feed it just with the vertices, here is the code:
vert = lin.get_vertices()
from numpy import min, max, linspace
from matplotlib.mlab import griddata
import matplotlib.pyplot as plt
# make up data.
#npts = int(raw_input('enter # of random points to plot:'))
npts = 200
x = vert[:, 0]
y = vert[:, 1]
z = vert[:, 2]
# define grid.
xi = linspace(min(x), max(x), 100)
yi = linspace(min(y), max(y), 100)
# grid the data.
zi = griddata(x,y,z,xi,yi)
# contour the gridded data, plotting dots at the nonuniform data points.
CS = plt.contour(xi,yi,zi,15,linewidths=0.5,colors='k')
CS = plt.contourf(xi,yi,zi,15,cmap=plt.cm.jet)
plt.colorbar() # draw colorbar
plt.title('Solution (%d points)' % npts)
The output of which is attached. It looks ugly, because mpl doesn't
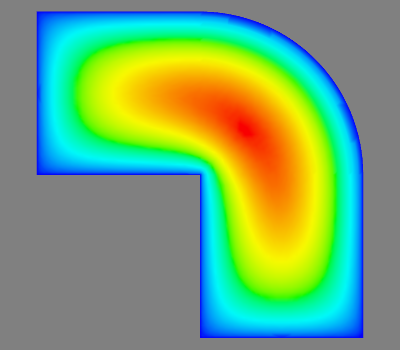
have enough information about the domain. Mayavi can use this
information with this script:
vert = lin.get_vertices()
triangles = lin.get_triangles()
from numpy import zeros
from enthought.mayavi import mlab
x = vert[:, 0]
y = vert[:, 1]
z = zeros(len(y))
t = vert[:, 2]
# the off screen rendering properly works only with VTK-5.2 or above:
mlab.options.offscreen = True
s = mlab.triangular_mesh(x, y, z, triangles, scalars=t)
mlab.view(azimuth=90, elevation=180)
the output of which is attached. Mayavi is good, but it's a little
overkill for this purpose, as it takes a while to start etc. I want to
use it inside the Sage notebook, where matplotlib is faster and takes
less memory. Also it's way easier to install (e.g. no vtk, and
fiddling with os mesa).
Thanks for any ideas.
Ondrej