Hi,
I'm doing some simple 3d plots with matplotlib. So far I have used
Axes3D.plot which works well. However, I would like to be able to
either fill the curves, or at least hide lines which are 'behind'
other curves. Can this be done?
I don't think it should be hard to do given the other 3d routines
available, but I had a look and got quickly lost amongst various
Wrap3D and Patch3D routines. These look hopeful, but I am not good
enough with matplotlib internals to work this out quickly.
Any help?
Thanks,
John
Well I have just about managed to do it, by copying the test_polys
function and much trial and error. I must admit that I don't fully
understand the code still. But given some gentle love, it works!
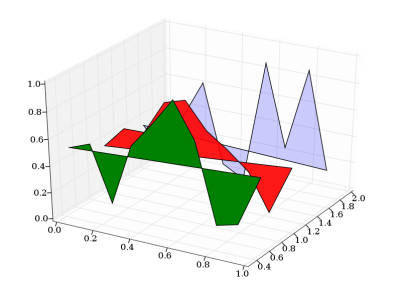
Attached is a patch (which I don't recommend be used until someone
wise about matplotlib has reviewed it) and an example script and the
image produced.
If there is a better/easier way then please let me know.
Cheers,
John
fill3d.patch (1.27 KB)
example_fill3d.py (331 Bytes)
···
On 13/02/07, John Travers <[email protected]...> wrote:
Hi,
I'm doing some simple 3d plots with matplotlib. So far I have used
Axes3D.plot which works well. However, I would like to be able to
either fill the curves, or at least hide lines which are 'behind'
other curves. Can this be done?
I don't think it should be hard to do given the other 3d routines
available, but I had a look and got quickly lost amongst various
Wrap3D and Patch3D routines. These look hopeful, but I am not good
enough with matplotlib internals to work this out quickly.