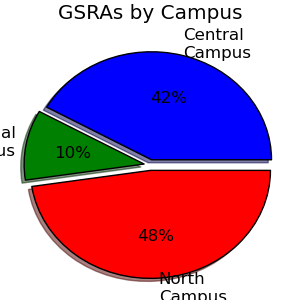
Hi, I am making a simple pie chart that needs to be small ~3x3 inches. The problem I am having is that the text labels get pushed out side the figure. Is there anyway to make the plot smaller relative to the figure size? Here is my code and the resulting plot:
GSRA_pie.py (328 Bytes)
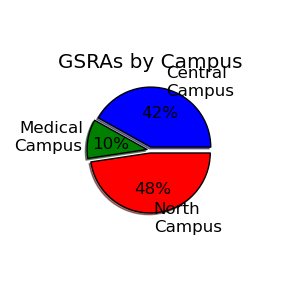
Hi Michael,
If you reduce the axes in size the pie chart will be reduced as well, so maybe
something like
ax = axes([0.25, 0.25, 0.5, 0.5])
is all you need to do. I attached the resulting picture for your interest.
Kind regards,
Matthias
···
On Tuesday August 10 2010 20:31:02 Michael Waters wrote:
Hi, I am making a simple pie chart that needs to be small ~3x3 inches.
The problem I am having is that the text labels get pushed out side the
figure. Is there anyway to make the plot smaller relative to the figure
size? Here is my code and the resulting plot: