Hi everyone,
So I am working on building a little tool for myself to observe my spending behavior and I have a bunch of dataframes for different categories that I eventually use in a pie chart.
This is what this piechart looks like. As you can see, its actually two charts.
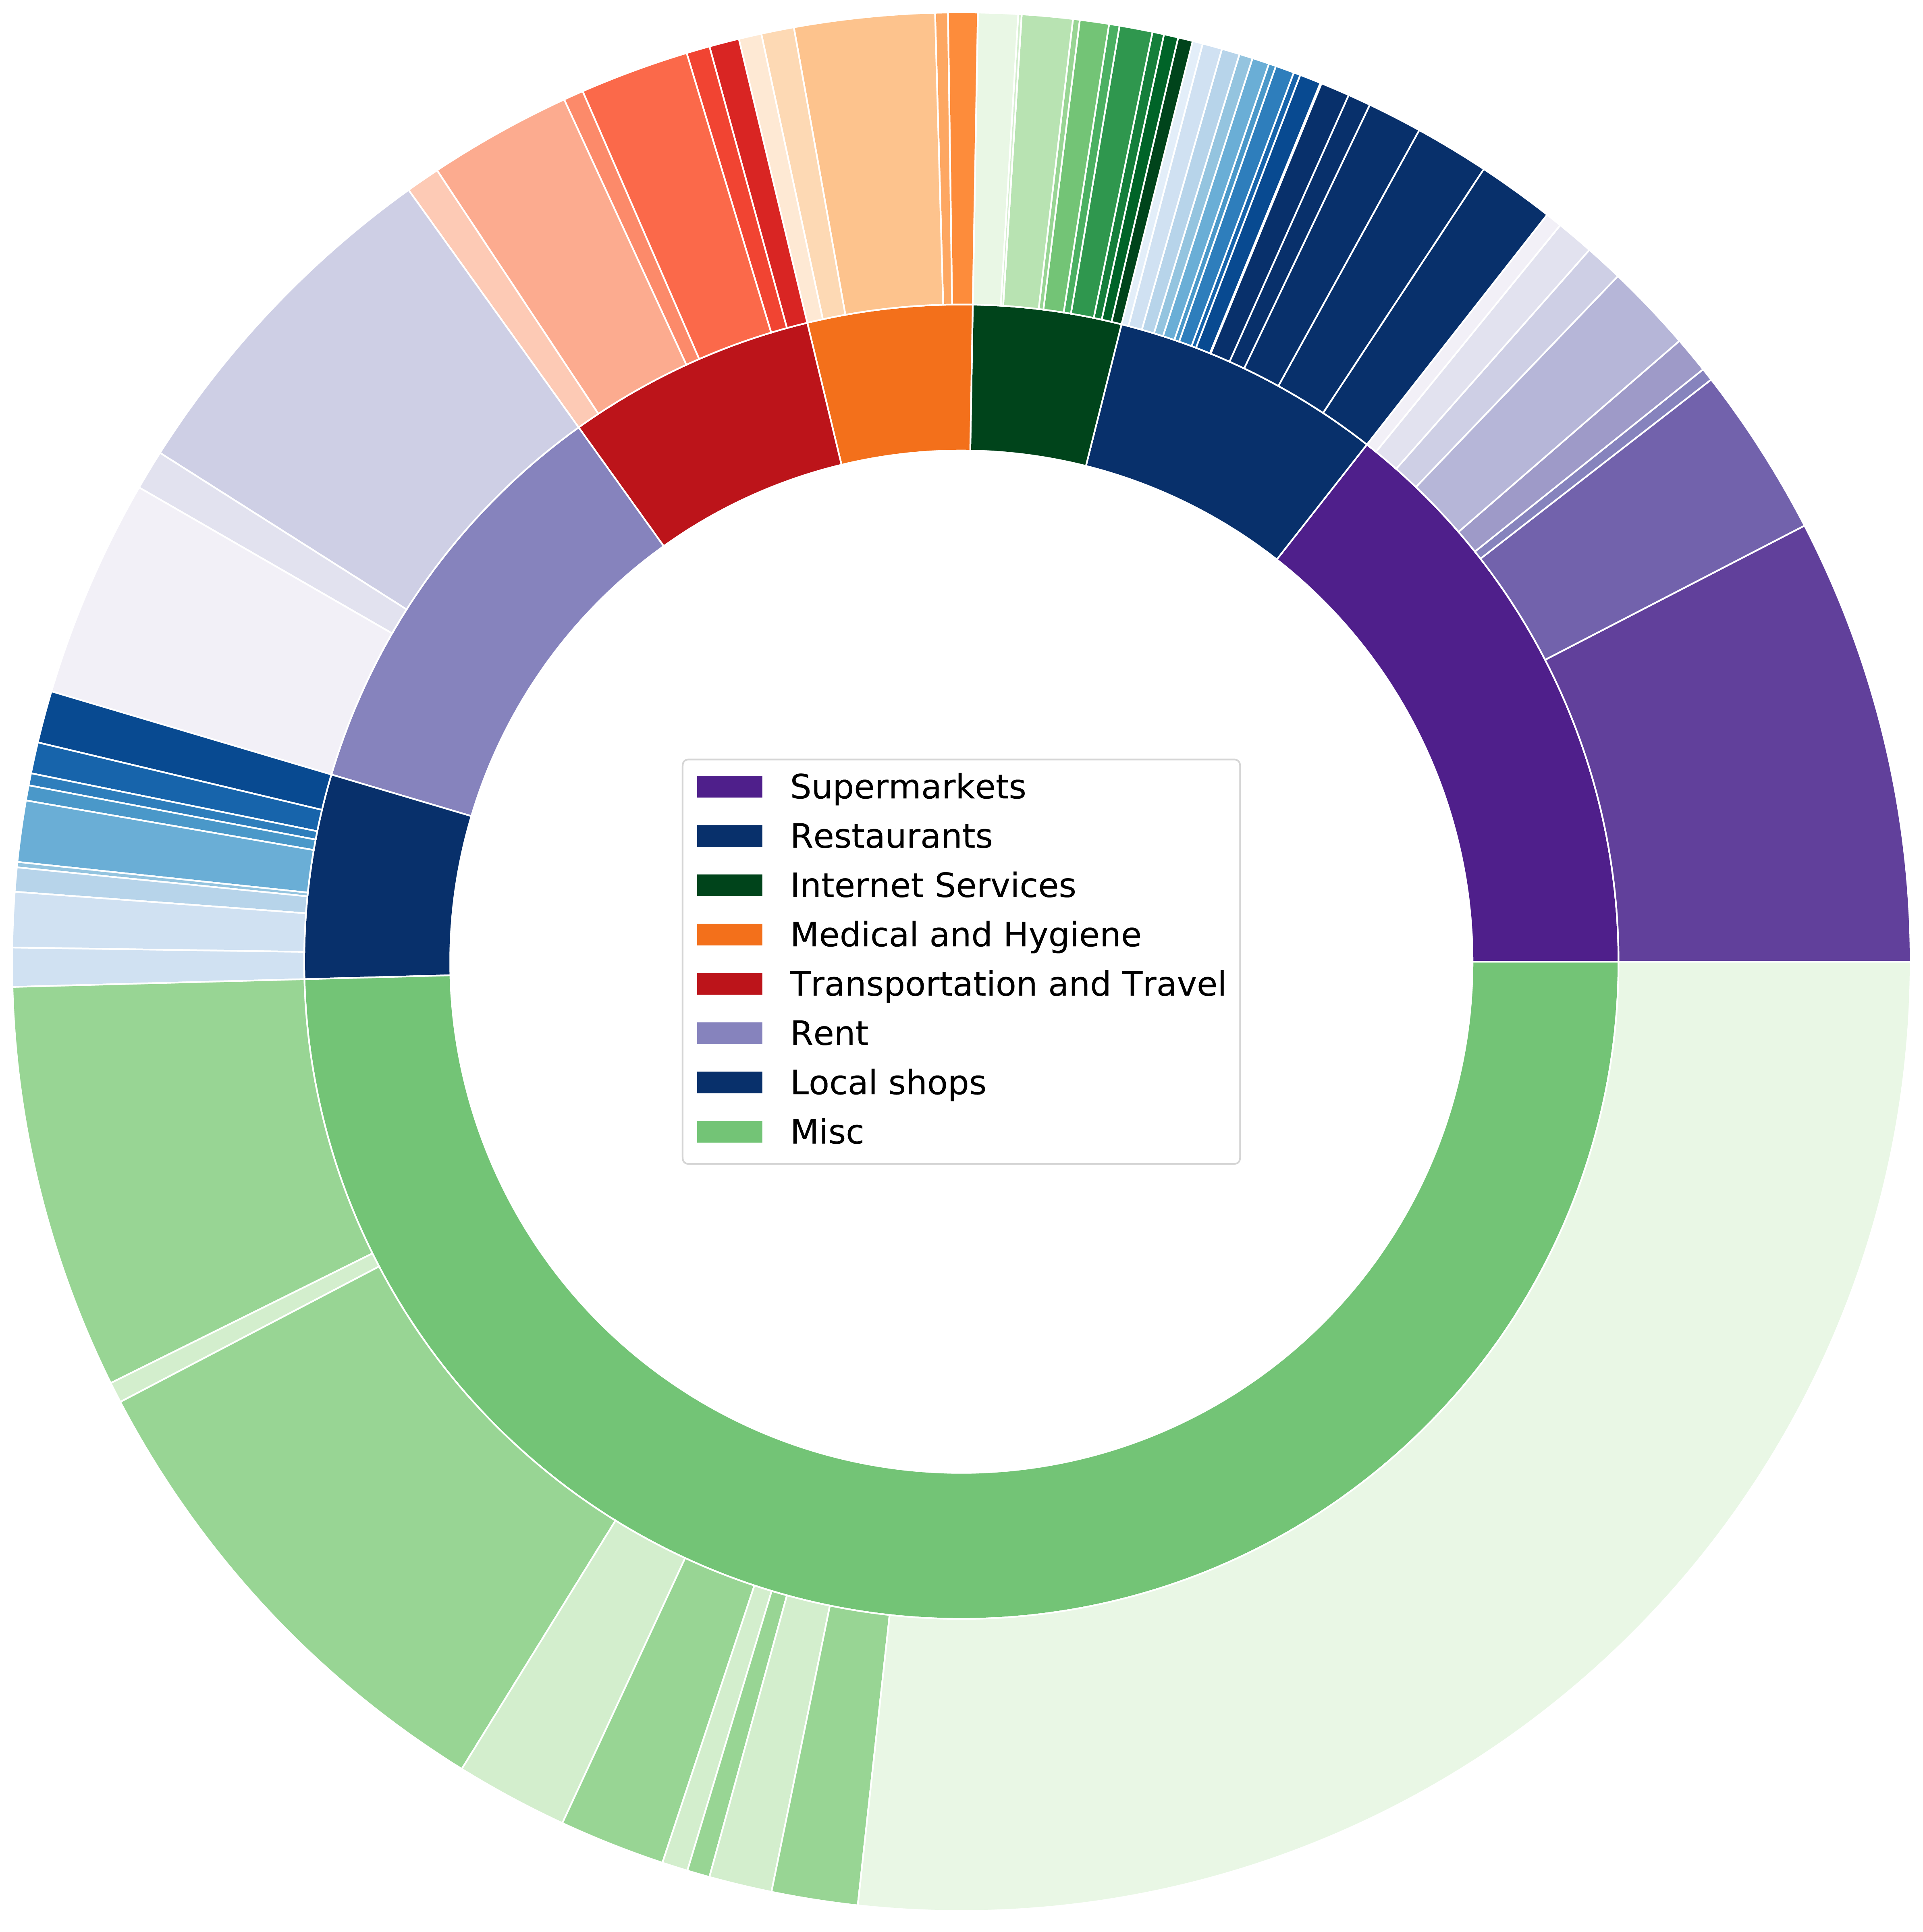
Now, assigning the colors manually is a pain and if I change something in the categories it would be extra work to correct the colors too. So obviously I would like to change to be automatic.
At this point the code for the colors is manual:
# Create colors
a, b, c, d, e=[plt.cm.Purples, plt.cm.Blues, plt.cm.Greens, plt.cm.Oranges, plt.cm.Reds]
Followed by this monster
mypie2, _ = ax.pie(subgroup_size, radius=1.3, labeldistance=0.7, colors=[a(0.8), a(0.7), a(0.6),a(0.5), a(0.4), a(0.3),a(0.2), a(0.1), b(1.5), b(1.4),b(1.3), b(1.2),b(1.1), b(1.0),b(0.9), b(0.8),b(0.7),b(0.6),b(0.5), b(0.4),b(0.3), b(0.2),b(0.1), c(1.0), c(0.9), c(0.8), c(0.7), c(0.6),c(0.5), c(0.4), c(0.3), c(0.2), c(0.1), d(0.5),d(0.4),d(0.3),d(0.2),d(0.1), e(0.7), e(0.6), e(0.5), e(0.4), e(0.3), e(0.2), a(0.3),a(0.2), a(0.1),b(0.9), b(0.8),b(0.7), b(0.6),b(0.5), b(0.4),b(0.3), b(0.2),b(0.2), c(0.4), c(0.2), c(0.4), c(0.2), c(0.4), c(0.2), c(0.4), c(0.2), c(0.4), c(0.1)])
I understand this is probably pretty terrible and thus I would like to automatically assign it.
So I thought i just create the “colors” variable automatically but I am running into problems because I somehow need to create this tuple but I don’t quite get how.
Here is the code that gives me a list but that is obviously not working here.
In:
colors = []
counter_spm = len(expenses_details_contains_spm)/10+0.1
counter_restaurants= len(expenses_details_contains_restaurant)/10+0.1
counter_internet= len(expenses_details_contains_internet)/10+0.1
counter_medic= len(expenses_details_contains_medic)/10+0.1
counter_transport= len(expenses_details_contains_transport)/10+0.1
counter_rent= len(rent)/10+0.1
counter_local= len(expenses_details_contains_local)/10+0.1
counter_misc= len(misc_transfers_2)/10+0.1


for entry in subgroup_names:
    if entry in expenses_details_contains_spm:
        counter_spm = counter_spm-0.1
        counter_spm_str = str(round(counter_spm,2))
        color = 'a('+counter_spm_str+')'
        colors.append(color)
    elif entry in expenses_details_contains_restaurant:
        counter_restaurants = counter_restaurants-0.1
        counter_restaurants_str = str(round(counter_restaurants,2))
        color = 'b('+counter_restaurants_str+')'
        colors.append(color)
    elif entry in expenses_details_contains_internet:
        counter_internet = counter_internet -0.1
        counter_internet_str = str(round(counter_internet,2))
        color = 'c('+counter_internet_str+')'
        colors.append(color)
    elif entry in expenses_details_contains_medic:
        counter_medic = counter_medic -0.1
        counter_medic_str = str(round(counter_medic,2))
        color = 'd('+counter_medic_str+')'
        colors.append(color)
    elif entry in expenses_details_contains_transport:
        counter_transport = counter_transport-0.1
        counter_transport_str = str(round(counter_transport,2))
        color = 'e('+counter_transport_str+')'
        colors.append(color)
    elif entry in rent:
        counter_rent = counter_rent -0.1
        counter_rent_str = str(round(counter_rent,2))
        color = 'a('+counter_rent_str+')'
        colors.append(color)
    elif entry in expenses_details_contains_local:
        counter_local = counter_local -0.1
        counter_local_str = str(round(counter_local,2))
        color = 'b('+counter_local_str+')'
        colors.append(color)
    elif entry in misc_transfers_2:
        counter_misc = counter_misc -0.1
        counter_misc_str = str(round(counter_misc,2))
        color = 'c('+counter_misc_str+')'
        colors.append(color)

print (colors)
Out
['a(0.8)', 'a(0.7)', 'a(0.6)', 'a(0.5)', 'a(0.4)', 'a(0.3)', 'a(0.2)', 'a(0.1)', 'b(1.5)', 'b(1.4)', 'b(1.3)', 'b(1.2)', 'b(1.1)', 'b(1.0)', 'b(0.9)', 'b(0.8)', 'b(0.7)', 'b(0.6)', 'b(0.5)', 'b(0.4)', 'b(0.3)', 'b(0.2)', 'b(0.1)', 'c(1.0)', 'c(0.9)', 'c(0.8)', 'c(0.7)', 'c(0.6)', 'c(0.5)', 'c(0.4)', 'c(0.3)', 'c(0.2)', 'c(0.1)', 'd(0.5)', 'd(0.4)', 'd(0.3)', 'd(0.2)', 'd(0.1)', 'e(0.6)', 'e(0.5)', 'e(0.4)', 'e(0.3)', 'e(0.2)', 'e(0.1)', 'a(0.3)', 'a(0.2)', 'a(0.1)', 'b(0.9)', 'b(0.8)', 'b(0.7)', 'b(0.6)', 'b(0.5)', 'b(0.4)', 'b(0.3)', 'b(0.2)', 'b(0.1)', 'c(1.0)', 'c(0.9)', 'c(0.8)', 'c(0.7)', 'c(0.6)', 'c(0.5)', 'c(0.4)', 'c(0.3)', 'c(0.2)', 'c(0.1)']
So which is cute, but sadly is all strings in a list. Maybe someone has an idea on how to assign the color automatically.
Thanks for taking the time to read my ghetto code.