Hi Eric,
Thanks for your reply. It made me realise a few things....
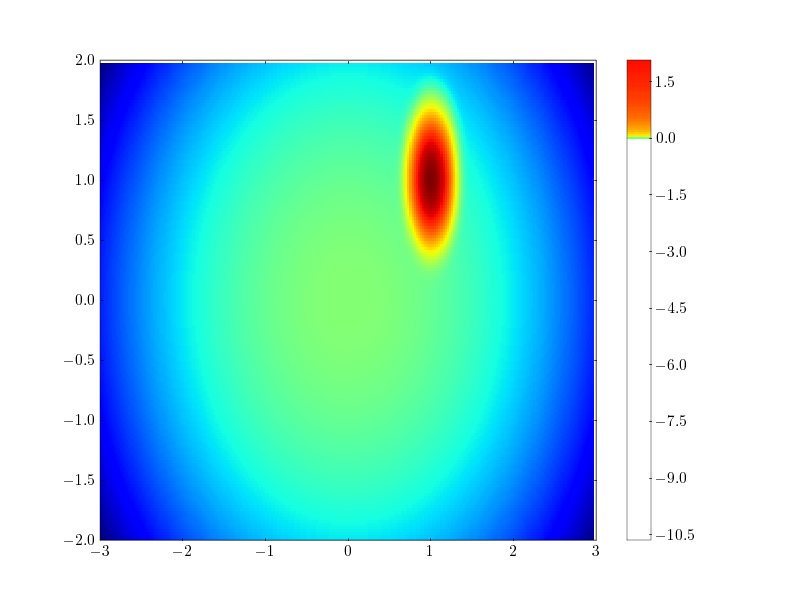
> But when I add a colorbar it goes wrong. The colorbar is labelled with
> the log of the values, rather
> than values, and the colour only fills the top third of the colorbar.
In the absence of additional kwargs, colorbar uses norm.vmin and
norm.vmax to determine the limits of the colorbar, and it uses a default
formatter. It has no way of knowing that you have taken the log of your
original values.
Yes of course there is in inconsistency in my LogNorm class. norm.vmax
will return the log of the maximum, when logically it should return
the max of the actual maximum. I've modified my example to take this
into account. see attached (and updated version online).
Colorbar will need some kwargs, at the very least. The "format" kwarg,
for example, can be used to pass in a Formatter instance so that a label
is 10^-3 instead of -3.
Ah I'd not discovered Formatters yet. But this does give a good solution.
If I instead do a pcolor of the log of my data, and then use a
FormatStrFormatter as you surgested:
pcolor(X,Y,log10(Z1),shading='flat')
colorbar(format=FormatStrFormatter('10^\{%d\}'))
I get exactly what I want  Its not the most intuitive way to do it,
but it works and I can't see any major drawbacks.
I am not sure why only the top is colored in your example--it might be a
bug or it might be an indication that additional kwargs are needed. I
am reasonably sure there is a simple solution, but I can't look at it
any more right now--maybe I can get back to it this evening.
I'm pretty sure the reason only the top was coloured is to do in the
inconsistency I described above. Once I fixed that the colorbar is
fine except that it is not on a log scale. But of course it can't know
that it is suppost to be on a log scale! I tried to do:
gca().axes[1].set_ylim((1e-5,1))
gca().axes[1].set_yscale('log')
but that doesn't work. I get a load of errors :
exceptions.ValueError Traceback (most
recent call last)
/usr/lib/python2.4/site-packages/matplotlib/backends/backend_gtk.py in
expose_event(self, widget, event)
282 x, y, w, h = self.allocation
283 self._pixmap_prepare (w, h)
--> 284 self._render_figure(self._pixmap, w, h)
285 self._need_redraw = False
286
/usr/lib/python2.4/site-packages/matplotlib/backends/backend_gtkagg.py
in _render_figure(self, pixmap, width, height)
71 def _render_figure(self, pixmap, width, height):
72 if DEBUG: print 'FigureCanvasGTKAgg.render_figure'
---> 73 FigureCanvasAgg.draw(self)
74 if DEBUG: print 'FigureCanvasGTKAgg.render_figure
pixmap', pixmap
75 #agg_to_gtk_drawable(pixmap, self.renderer._renderer, None)
/usr/lib/python2.4/site-packages/matplotlib/backends/backend_agg.py in
draw(self)
390
391 renderer = self.get_renderer()
--> 392 self.figure.draw(renderer)
393
394 def get_renderer(self):
/usr/lib/python2.4/site-packages/matplotlib/figure.py in draw(self, renderer)
542
543 # render the axes
--> 544 for a in self.axes: a.draw(renderer)
545
546 # render the figure text
/usr/lib/python2.4/site-packages/matplotlib/axes.py in draw(self,
renderer, inframe)
1061
1062 for zorder, i, a in dsu:
-> 1063 a.draw(renderer)
1064
1065 self.transData.thaw() # release the lazy objects
/usr/lib/python2.4/site-packages/matplotlib/patches.py in draw(self, renderer)
163
164 verts = self.get_verts()
--> 165 tverts = self._transform.seq_xy_tups(verts)
166
167 renderer.draw_polygon(gc, rgbFace, tverts)
ValueError: Domain error on nonlinear Transformation::seq_xy_tups
operator()(thisx, thisy)
As for how to solve the problem properly. Matlab allows one to set to
caxis scale to log. Maybe colorbar could detect that the norm instance
was an instance of LogNorm and scale the yaxis logarithmicly. Or would
it be better to put a scale={'log','linear'} kwarg into colorbar()?
Thanks again for your help.
cheers
JIM
pcolor_log.py (2.86 KB)
···
---
