path simplification can decrease the smoothness of data plots
I’m really excited about the new path simplification option for vector output formats. I tried it the first time yesterday and reduced a PDF from 231 kB to 47 kB. Thanks very much for providing this feature!
However, I have noticed that the simplified paths often look more jagged than the original, at least for my data. I can recreate the effect with the following:
[start]
import numpy as np
import matplotlib.pyplot as plt
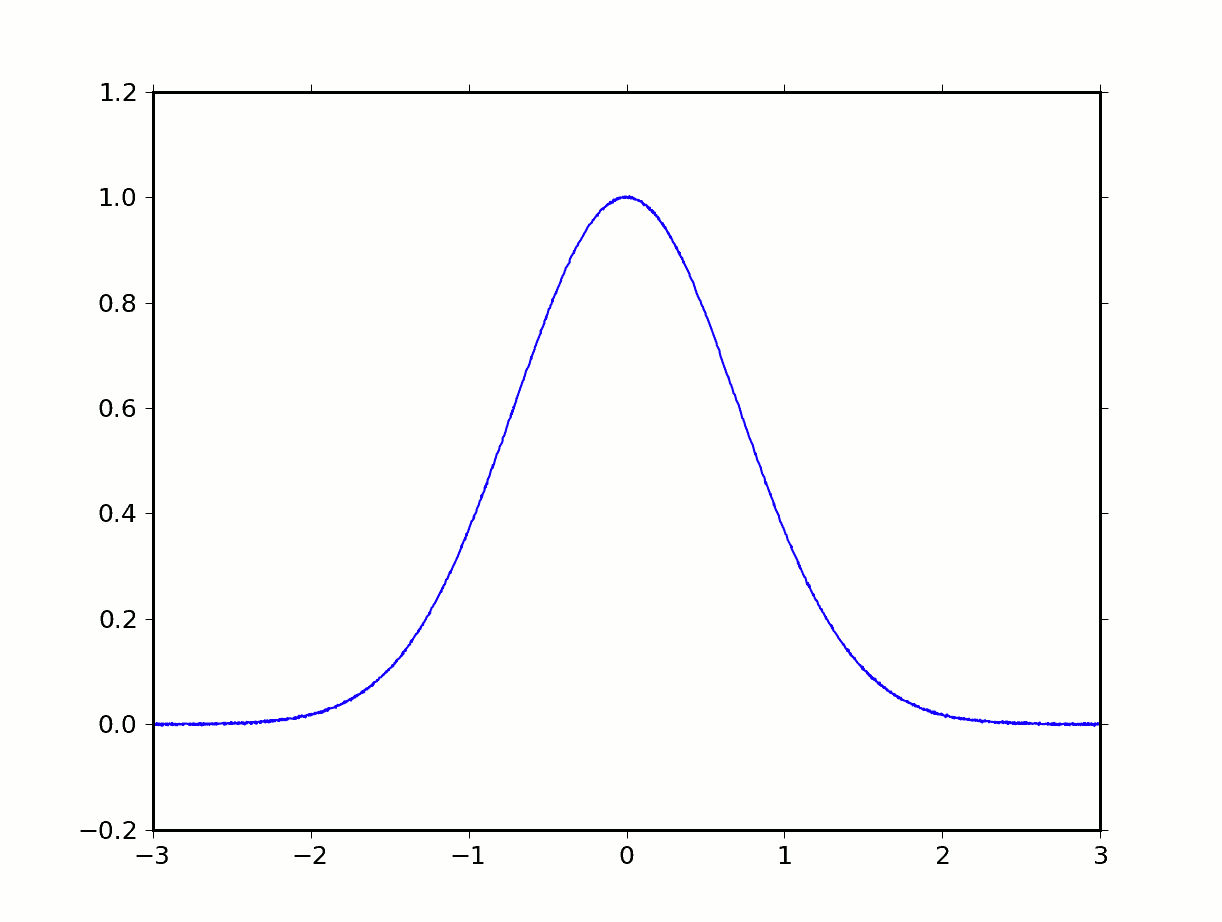
x = np.arange(-3,3,0.001)
y = np.exp(-x**2) + np.random.normal(scale=0.001,size=x.size)
plt.plot(x,y)
plt.savefig(‘test.png’)
plt.savefig(‘test.pdf’)
[end]
A sample output is attached, and close inspection shows that the PNG is a smooth curve with a small amount of noise while the PDF version has very noticeable changes in direction from one line segment to the next.
<<test.png>> <<test.pdf>>
The simplification algorithm (agg_py_path_iterator.h) does the following:
If line2 is nearly parallel to line1, add the parallel component to the length of line1, leaving it direction unchanged
which results in a new data point, not contained in the original data. Line1 will continue to be lengthened until it has deviated from the data curve enough that the next true data point is considered non-parallel. The cycle then continues. The result is a line that wanders around the data curve, and only the first point is guaranteed to have existed in the original data set.
Instead, could the simplification algorithm do:
If line2 is nearly parallel to line1, combine them by removing the common point, leaving a single line where both end points existed in the original data
Thanks again,
Andrew Hawryluk
test.pdf (14.1 KB)