Hi,
I have created a patch against latest svn that adds a function step to the axes class to plot step-functions ![]() It's really simple but nice ... Any interest in adding this?
It's really simple but nice ... Any interest in adding this?
Manuel
stepplot.patch (666 Bytes)
Hi,
I have created a patch against latest svn that adds a function step to the axes class to plot step-functions ![]() It's really simple but nice ... Any interest in adding this?
It's really simple but nice ... Any interest in adding this?
Manuel
stepplot.patch (666 Bytes)
Hi,
I have created a patch against latest svn that adds a function step to
the axes class to plot step-functionsIt’s really simple but nice …
Any interest in adding this?Manuel
Index: axes.py
===================================================================
— axes.py (revision
3709)+++ axes.py (working
copy)@@ -4995,6 +4995,18 @@
steps=[1, 2, 5, 10],
integer=True))
return im
def step(self, x, y, *args, **kwargs):
x2 = npy.zeros((2*len(x)),npy.float32)
y2 = npy.zeros((2*len(x)),npy.float32)
x2[0::2] = xx2[1::2] = xy2[1::2] = yy2[2::2] = y[:-1]self.plot(x2, y2, *args,**kwargs)
class SubplotBase:
"""
This SF.net email is sponsored by: Splunk Inc.
Still grepping through log files to find problems? Stop.
Now Search log events and configuration files using AJAX and a
browser.Download your FREE copy of Splunk now >>
http://get.splunk.com/
Matplotlib-devel mailing list
https://lists.sourceforge.net/lists/listinfo/matplotlib-devel
Manuel,
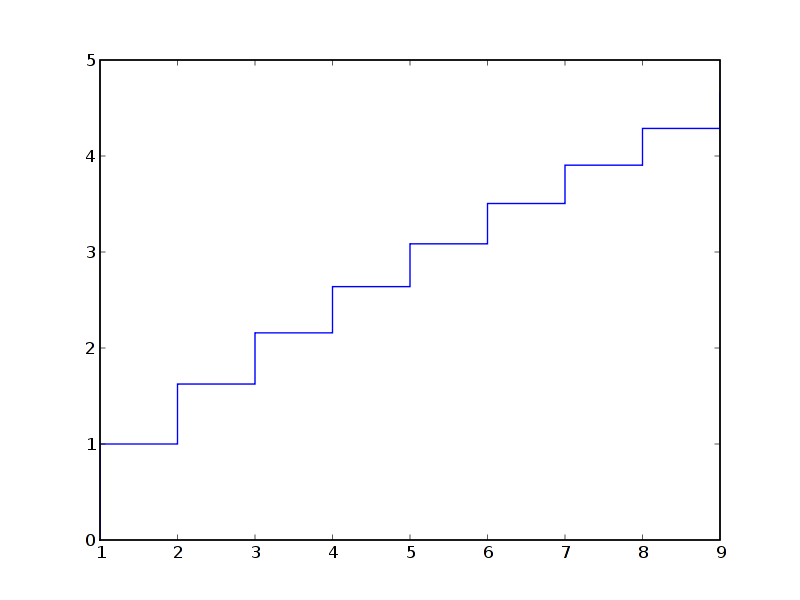
We do plots like this all the time. One thing we’ve found that’s
nice to have is a keyword that controls when the increase in y
happens. We use a step style keyword that can be ‘pre’ (go up then
right), ‘post’ (go right then up), and ‘mid’ (right 0.5, up, right
0.5).
Regarding your patch, you might want to check other areas in MPL for data
processing examples. I could be wrong but I’m not sure you can
assume that incoming data is a float. Some of the unit conversion
examples or the line collection code might have better examples.
Ted
At 07:59 AM 8/14/2007, Manuel Metz wrote:
Ted Drain wrote:
Manuel,
We do plots like this all the time. One thing we've found that's nice to have is a keyword that controls when the increase in y happens. We use a step style keyword that can be 'pre' (go up then right), 'post' (go right then up), and 'mid' (right 0.5, up, right 0.5).
Good idea.
Regarding your patch, you might want to check other areas in MPL for data processing examples. I could be wrong but I'm not sure you can assume that incoming data is a float. Some of the unit conversion examples or the line collection code might have better examples.
Incoming data can be any numeric type, but it ends up getting converted to the default float type (not float32) internally.
Whenever possible, it is good to support masked array input.
Eric
Ted
At 07:59 AM 8/14/2007, Manuel Metz wrote:
Hi,
I have created a patch against latest svn that adds a function step to the axes class to plot step-functions
Manuel
Index: axes.py
--- axes.py (revision 3709)
+++ axes.py (working copy)
@@ -4995,6 +4995,18 @@
steps=[1, 2, 5, 10],
integer=True))
return im
+ + def step(self, x, y, *args, **kwargs):
+ x2 = npy.zeros((2*len(x)), npy.float32)
+ y2 = npy.zeros((2*len(x)), npy.float32)
+ + x2[0::2] = x
+ x2[1::2] = x
+ + y2[1::2] = y
+ y2[2::2] = y[:-1]
+ + self.plot(x2, y2, *args, **kwargs)
class SubplotBase:
"""-------------------------------------------------------------------------
This SF.net email is sponsored by: Splunk Inc.
Still grepping through log files to find problems? Stop.
Now Search log events and configuration files using AJAX and a browser.
Download your FREE copy of Splunk now >> http://get.splunk.com/
_______________________________________________
Matplotlib-devel mailing list
[email protected]
matplotlib-devel List Signup and Options------------------------------------------------------------------------
-------------------------------------------------------------------------
This SF.net email is sponsored by: Splunk Inc.
Still grepping through log files to find problems? Stop.
Now Search log events and configuration files using AJAX and a browser.
Download your FREE copy of Splunk now >> http://get.splunk.com/------------------------------------------------------------------------
_______________________________________________
Matplotlib-devel mailing list
[email protected]
matplotlib-devel List Signup and Options
Ted Drain wrote:
Manuel,
We do plots like this all the time. One thing we’ve found that’s
nice to have is a keyword that controls when the increase in y
happens. We use a step style keyword that can be ‘pre’ (go up then
right), ‘post’ (go right then up), and ‘mid’ (right 0.5, up, right 0.5).
Good idea.
Regarding your patch, you might
want to check other areas in MPL for data processing examples. I
could be wrong but I’m not sure you can assume that incoming data is a
float. Some of the unit conversion examples or the line collection
code might have better examples.Incoming data can be any numeric type, but it ends up getting converted
to the default float type (not float32) internally.Whenever possible, it is good to support masked array input.
Agreed - but the way the patch was written, I don’t think it will support
anything but float (especially not the unit types).
At 10:36 AM 8/14/2007, Eric Firing wrote:
Ted
At 07:59 AM 8/14/2007, Manuel Metz wrote:
Hi,
I have created a patch against latest svn that adds a function step to
the axes class to plot step-functions
Any interest in adding this?Manuel
Index: axes.py
===================================================================
— axes.py (revision 3709)
+++ axes.py (working copy)
@@ -4995,6 +4995,18 @@
steps=[1, 2, 5, 10],
integer=True))
return im
def step(self, x, y, *args, **kwargs):
x2 = npy.zeros((2*len(x)),npy.float32)
y2 = npy.zeros((2*len(x)),npy.float32)
x2[0::2] = xx2[1::2] = xy2[1::2] = yy2[2::2] = y[:-1]self.plot(x2, y2, *args,**kwargs)
class SubplotBase:
"""
This SF.net email is sponsored by: Splunk Inc.
Still grepping through log files to find problems? Stop.
Now Search log events and configuration files using AJAX and a
browser.Download your FREE copy of Splunk now >>
http://get.splunk.com/
Matplotlib-devel mailing list
https://lists.sourceforge.net/lists/listinfo/matplotlib-devel
Eric
Hi,
okay, I have added a keyword 'where' as suggested. I also now changed the way the incoming data is converted. I took this from the axes.pie() function. I don't know much about the unit types yet ![]()
Concerning masked arrays: Do I have to consider something special there?
Manuel
Ted Drain wrote:
stepplot.patch (1.5 KB)
stepplot_example.py (255 Bytes)
At 10:36 AM 8/14/2007, Eric Firing wrote:
Ted Drain wrote:
Manuel,
We do plots like this all the time. One thing we've found that's nice to have is a keyword that controls when the increase in y happens. We use a step style keyword that can be 'pre' (go up then right), 'post' (go right then up), and 'mid' (right 0.5, up, right 0.5).Good idea.
Regarding your patch, you might want to check other areas in MPL for data processing examples. I could be wrong but I'm not sure you can assume that incoming data is a float. Some of the unit conversion examples or the line collection code might have better examples.
Incoming data can be any numeric type, but it ends up getting converted to the default float type (not float32) internally.
Whenever possible, it is good to support masked array input.
Agreed - but the way the patch was written, I don't think it will support anything but float (especially not the unit types).
Eric
Ted
At 07:59 AM 8/14/2007, Manuel Metz wrote:Hi,
I have created a patch against latest svn that adds a function step to the axes class to plot step-functions
Manuel
Index: axes.py
--- axes.py (revision 3709)
+++ axes.py (working copy)
@@ -4995,6 +4995,18 @@
steps=[1, 2, 5, 10],
integer=True))
return im
+
+ def step(self, x, y, *args, **kwargs):
+ x2 = npy.zeros((2*len(x)), npy.float32)
+ y2 = npy.zeros((2*len(x)), npy.float32)
+
+ x2[0::2] = x
+ x2[1::2] = x
+
+ y2[1::2] = y
+ y2[2::2] = y[:-1]
+
+ self.plot(x2, y2, *args, **kwargs)class SubplotBase:
"""-------------------------------------------------------------------------
This SF.net email is sponsored by: Splunk Inc.
Still grepping through log files to find problems? Stop.
Now Search log events and configuration files using AJAX and a browser.
Download your FREE copy of Splunk now >> http://get.splunk.com/
_______________________________________________
Matplotlib-devel mailing list
[email protected]
matplotlib-devel List Signup and Options------------------------------------------------------------------------
-------------------------------------------------------------------------This SF.net email is sponsored by: Splunk Inc.
Still grepping through log files to find problems? Stop.
Now Search log events and configuration files using AJAX and a browser.
Download your FREE copy of Splunk now >> http://get.splunk.com/------------------------------------------------------------------------
_______________________________________________
Matplotlib-devel mailing list
[email protected]
matplotlib-devel List Signup and Options------------------------------------------------------------------------
-------------------------------------------------------------------------
This SF.net email is sponsored by: Splunk Inc.
Still grepping through log files to find problems? Stop.
Now Search log events and configuration files using AJAX and a browser.
Download your FREE copy of Splunk now >> http://get.splunk.com/------------------------------------------------------------------------
_______________________________________________
Matplotlib-devel mailing list
[email protected]
matplotlib-devel List Signup and Options
May I ask again: Is there any interest in a step-plotting function?
If so, who will commit the patch? Do I have to add more myself (documentation for sure needs to be added, what else ?)
Manuel
Manuel Metz wrote:
Hi,
okay, I have added a keyword 'where' as suggested. I also now changed the way the incoming data is converted. I took this from the axes.pie() function. I don't know much about the unit types yetConcerning masked arrays: Do I have to consider something special there?
Manuel
Ted Drain wrote:
At 10:36 AM 8/14/2007, Eric Firing wrote:
Ted Drain wrote:
Manuel,
We do plots like this all the time. One thing we've found that's nice to have is a keyword that controls when the increase in y happens. We use a step style keyword that can be 'pre' (go up then right), 'post' (go right then up), and 'mid' (right 0.5, up, right 0.5).Good idea.
Regarding your patch, you might want to check other areas in MPL for data processing examples. I could be wrong but I'm not sure you can assume that incoming data is a float. Some of the unit conversion examples or the line collection code might have better examples.
Incoming data can be any numeric type, but it ends up getting converted to the default float type (not float32) internally.
Whenever possible, it is good to support masked array input.
Agreed - but the way the patch was written, I don't think it will support anything but float (especially not the unit types).
Eric
Ted
At 07:59 AM 8/14/2007, Manuel Metz wrote:Hi,
I have created a patch against latest svn that adds a function step to the axes class to plot step-functions
Manuel
Index: axes.py
--- axes.py (revision 3709)
+++ axes.py (working copy)
@@ -4995,6 +4995,18 @@
steps=[1, 2, 5, 10],
integer=True))
return im
+
+ def step(self, x, y, *args, **kwargs):
+ x2 = npy.zeros((2*len(x)), npy.float32)
+ y2 = npy.zeros((2*len(x)), npy.float32)
+
+ x2[0::2] = x
+ x2[1::2] = x
+
+ y2[1::2] = y
+ y2[2::2] = y[:-1]
+
+ self.plot(x2, y2, *args, **kwargs)class SubplotBase:
"""-------------------------------------------------------------------------
This SF.net email is sponsored by: Splunk Inc.
Still grepping through log files to find problems? Stop.
Now Search log events and configuration files using AJAX and a browser.
Download your FREE copy of Splunk now >> http://get.splunk.com/
_______________________________________________
Matplotlib-devel mailing list
[email protected]
matplotlib-devel List Signup and Options------------------------------------------------------------------------
-------------------------------------------------------------------------
This SF.net email is sponsored by: Splunk Inc.
Still grepping through log files to find problems? Stop.
Now Search log events and configuration files using AJAX and a browser.
Download your FREE copy of Splunk now >> http://get.splunk.com/------------------------------------------------------------------------
_______________________________________________
Matplotlib-devel mailing list
[email protected]
matplotlib-devel List Signup and Options------------------------------------------------------------------------
------------------------------------------------------------------------
-------------------------------------------------------------------------
This SF.net email is sponsored by: Splunk Inc.
Still grepping through log files to find problems? Stop.
Now Search log events and configuration files using AJAX and a browser.
Download your FREE copy of Splunk now >> http://get.splunk.com/------------------------------------------------------------------------
_______________________________________________
Matplotlib-devel mailing list
[email protected]
matplotlib-devel List Signup and Options
Manuel Metz wrote:
May I ask again: Is there any interest in a step-plotting function?
Yes, so thanks for taking the initiative and for being persistent.
If so, who will commit the patch? Do I have to add more myself (documentation for sure needs to be added, what else ?)
Please add a docstring and a simple demo suitable for the examples subdirectory. I will commit the patch, or some modification of it.
Manuel
Manuel Metz wrote:
Hi,
okay, I have added a keyword 'where' as suggested. I also now changed the way the incoming data is converted. I took this from the axes.pie() function. I don't know much about the unit types yetConcerning masked arrays: Do I have to consider something special there?
I think that if you change the npy.asarray to npyma.array, and similarly for the zeros(), that will provide basic masked array support. Please look at masked_demo.py for an example of the use of masked arrays. (It is very artificial, of course. A typical use case for masked arrays is when you have a data stream with some bad points that you want to edit out, but you want to keep the array dimensions unchanged. In the case of a line plot or step plot, you want the line to break at the missing point to show that a point has been removed.)
Eric
Manuel
Ted Drain wrote:
At 10:36 AM 8/14/2007, Eric Firing wrote:
Ted Drain wrote:
Manuel,
We do plots like this all the time. One thing we've found that's nice to have is a keyword that controls when the increase in y happens. We use a step style keyword that can be 'pre' (go up then right), 'post' (go right then up), and 'mid' (right 0.5, up, right 0.5).Good idea.
Regarding your patch, you might want to check other areas in MPL for data processing examples. I could be wrong but I'm not sure you can assume that incoming data is a float. Some of the unit conversion examples or the line collection code might have better examples.
Incoming data can be any numeric type, but it ends up getting converted to the default float type (not float32) internally.
Whenever possible, it is good to support masked array input.
Agreed - but the way the patch was written, I don't think it will support anything but float (especially not the unit types).
Eric
Ted
At 07:59 AM 8/14/2007, Manuel Metz wrote:Hi,
I have created a patch against latest svn that adds a function step to the axes class to plot step-functions
Manuel
Index: axes.py
--- axes.py (revision 3709)
+++ axes.py (working copy)
@@ -4995,6 +4995,18 @@
steps=[1, 2, 5, 10],
integer=True))
return im
+
+ def step(self, x, y, *args, **kwargs):
+ x2 = npy.zeros((2*len(x)), npy.float32)
+ y2 = npy.zeros((2*len(x)), npy.float32)
+
+ x2[0::2] = x
+ x2[1::2] = x
+
+ y2[1::2] = y
+ y2[2::2] = y[:-1]
+
+ self.plot(x2, y2, *args, **kwargs)class SubplotBase:
"""-------------------------------------------------------------------------
This SF.net email is sponsored by: Splunk Inc.
Still grepping through log files to find problems? Stop.
Now Search log events and configuration files using AJAX and a browser.
Download your FREE copy of Splunk now >> http://get.splunk.com/
_______________________________________________
Matplotlib-devel mailing list
[email protected]
matplotlib-devel List Signup and Options------------------------------------------------------------------------
-------------------------------------------------------------------------
This SF.net email is sponsored by: Splunk Inc.
Still grepping through log files to find problems? Stop.
Now Search log events and configuration files using AJAX and a browser.
Download your FREE copy of Splunk now >> http://get.splunk.com/------------------------------------------------------------------------
_______________________________________________
Matplotlib-devel mailing list
[email protected]
matplotlib-devel List Signup and Options------------------------------------------------------------------------
-------------------------------------------------------------------------
This SF.net email is sponsored by: Splunk Inc.
Still grepping through log files to find problems? Stop.
Now Search log events and configuration files using AJAX and a browser.
Download your FREE copy of Splunk now >> http://get.splunk.com/------------------------------------------------------------------------
_______________________________________________
Matplotlib-devel mailing list
[email protected]
matplotlib-devel List Signup and Options------------------------------------------------------------------------
------------------------------------------------------------------------
-------------------------------------------------------------------------
This SF.net email is sponsored by: Splunk Inc.
Still grepping through log files to find problems? Stop.
Now Search log events and configuration files using AJAX and a browser.
Download your FREE copy of Splunk now >> http://get.splunk.com/------------------------------------------------------------------------
_______________________________________________
Matplotlib-devel mailing list
[email protected]
matplotlib-devel List Signup and Options-------------------------------------------------------------------------
This SF.net email is sponsored by: Splunk Inc.
Still grepping through log files to find problems? Stop.
Now Search log events and configuration files using AJAX and a browser.
Download your FREE copy of Splunk now >> http://get.splunk.com/
_______________________________________________
Matplotlib-devel mailing list
[email protected]
matplotlib-devel List Signup and Options
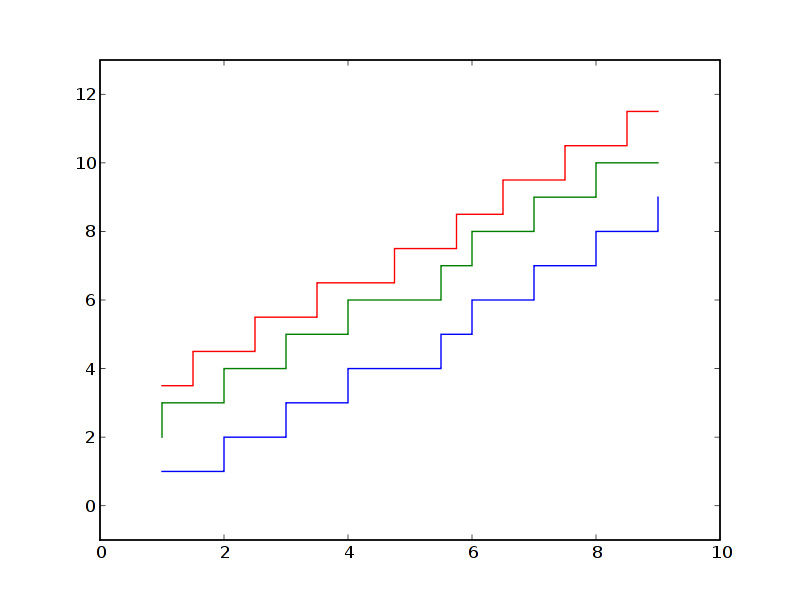
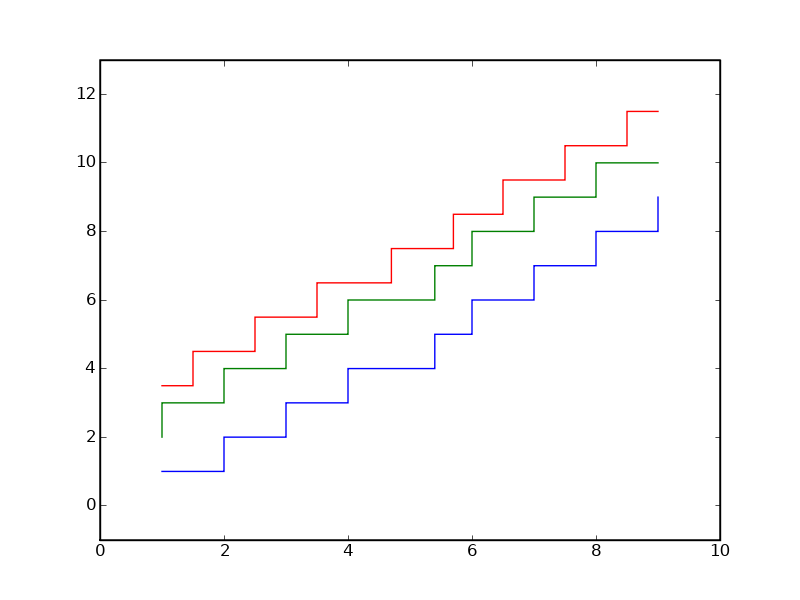
Okay, I changed from npy.asarray -> npy.ma.array and checked that it works. I also added a doc. The patch as well as an example code and its output are attached.
Please note that the example actually call ax.step directly instead of using the pylab interface; I guess this has to be added (boilerplate.py?)
Manuel
Eric Firing wrote:
stepplot.patch (2.02 KB)
stepplot_example.py (268 Bytes)
Manuel Metz wrote:
May I ask again: Is there any interest in a step-plotting function?
Yes, so thanks for taking the initiative and for being persistent.
If so, who will commit the patch? Do I have to add more myself (documentation for sure needs to be added, what else ?)
Please add a docstring and a simple demo suitable for the examples subdirectory. I will commit the patch, or some modification of it.
Manuel
Manuel Metz wrote:
Hi,
okay, I have added a keyword 'where' as suggested. I also now changed the way the incoming data is converted. I took this from the axes.pie() function. I don't know much about the unit types yetConcerning masked arrays: Do I have to consider something special there?
I think that if you change the npy.asarray to npyma.array, and similarly for the zeros(), that will provide basic masked array support. Please look at masked_demo.py for an example of the use of masked arrays. (It is very artificial, of course. A typical use case for masked arrays is when you have a data stream with some bad points that you want to edit out, but you want to keep the array dimensions unchanged. In the case of a line plot or step plot, you want the line to break at the missing point to show that a point has been removed.)
Eric
Manuel
Ted Drain wrote:
At 10:36 AM 8/14/2007, Eric Firing wrote:
Ted Drain wrote:
Manuel,
We do plots like this all the time. One thing we've found that's nice to have is a keyword that controls when the increase in y happens. We use a step style keyword that can be 'pre' (go up then right), 'post' (go right then up), and 'mid' (right 0.5, up, right 0.5).Good idea.
Regarding your patch, you might want to check other areas in MPL for data processing examples. I could be wrong but I'm not sure you can assume that incoming data is a float. Some of the unit conversion examples or the line collection code might have better examples.
Incoming data can be any numeric type, but it ends up getting converted to the default float type (not float32) internally.
Whenever possible, it is good to support masked array input.
Agreed - but the way the patch was written, I don't think it will support anything but float (especially not the unit types).
Eric
Ted
At 07:59 AM 8/14/2007, Manuel Metz wrote:Hi,
I have created a patch against latest svn that adds a function step to the axes class to plot step-functions
Manuel
Index: axes.py
--- axes.py (revision 3709)
+++ axes.py (working copy)
@@ -4995,6 +4995,18 @@
steps=[1, 2, 5, 10],
integer=True))
return im
+
+ def step(self, x, y, *args, **kwargs):
+ x2 = npy.zeros((2*len(x)), npy.float32)
+ y2 = npy.zeros((2*len(x)), npy.float32)
+
+ x2[0::2] = x
+ x2[1::2] = x
+
+ y2[1::2] = y
+ y2[2::2] = y[:-1]
+
+ self.plot(x2, y2, *args, **kwargs)class SubplotBase:
"""-------------------------------------------------------------------------
This SF.net email is sponsored by: Splunk Inc.
Still grepping through log files to find problems? Stop.
Now Search log events and configuration files using AJAX and a browser.
Download your FREE copy of Splunk now >> http://get.splunk.com/
_______________________________________________
Matplotlib-devel mailing list
[email protected]
matplotlib-devel List Signup and Options------------------------------------------------------------------------
-------------------------------------------------------------------------
This SF.net email is sponsored by: Splunk Inc.
Still grepping through log files to find problems? Stop.
Now Search log events and configuration files using AJAX and a browser.
Download your FREE copy of Splunk now >> http://get.splunk.com/------------------------------------------------------------------------
_______________________________________________
Matplotlib-devel mailing list
[email protected]
matplotlib-devel List Signup and Options------------------------------------------------------------------------
-------------------------------------------------------------------------
This SF.net email is sponsored by: Splunk Inc.
Still grepping through log files to find problems? Stop.
Now Search log events and configuration files using AJAX and a browser.
Download your FREE copy of Splunk now >> http://get.splunk.com/------------------------------------------------------------------------
_______________________________________________
Matplotlib-devel mailing list
[email protected]
matplotlib-devel List Signup and Options------------------------------------------------------------------------
------------------------------------------------------------------------
-------------------------------------------------------------------------
This SF.net email is sponsored by: Splunk Inc.
Still grepping through log files to find problems? Stop.
Now Search log events and configuration files using AJAX and a browser.
Download your FREE copy of Splunk now >> http://get.splunk.com/------------------------------------------------------------------------
_______________________________________________
Matplotlib-devel mailing list
[email protected]
matplotlib-devel List Signup and Options-------------------------------------------------------------------------
This SF.net email is sponsored by: Splunk Inc.
Still grepping through log files to find problems? Stop.
Now Search log events and configuration files using AJAX and a browser.
Download your FREE copy of Splunk now >> http://get.splunk.com/
_______________________________________________
Matplotlib-devel mailing list
[email protected]
matplotlib-devel List Signup and Options
Manuel,
Thank you.
I will look at this ASAP, but it might not be right away. Just to be safe, if you haven't heard from me by Friday send me a message off the list.
Manuel Metz wrote:
Okay, I changed from npy.asarray -> npy.ma.array and checked that it works. I also added a doc. The patch as well as an example code and its output are attached.
Please note that the example actually call ax.step directly instead of using the pylab interface; I guess this has to be added (boilerplate.py?)
Yes, I can take care of that. No problem.
Eric
Manuel
Eric Firing wrote:
Manuel Metz wrote:
May I ask again: Is there any interest in a step-plotting function?
Yes, so thanks for taking the initiative and for being persistent.
If so, who will commit the patch? Do I have to add more myself (documentation for sure needs to be added, what else ?)
Please add a docstring and a simple demo suitable for the examples subdirectory. I will commit the patch, or some modification of it.
Manuel
Manuel Metz wrote:
Hi,
okay, I have added a keyword 'where' as suggested. I also now changed the way the incoming data is converted. I took this from the axes.pie() function. I don't know much about the unit types yetConcerning masked arrays: Do I have to consider something special there?
I think that if you change the npy.asarray to npyma.array, and similarly for the zeros(), that will provide basic masked array support. Please look at masked_demo.py for an example of the use of masked arrays. (It is very artificial, of course. A typical use case for masked arrays is when you have a data stream with some bad points that you want to edit out, but you want to keep the array dimensions unchanged. In the case of a line plot or step plot, you want the line to break at the missing point to show that a point has been removed.)
Eric
Manuel
Ted Drain wrote:
At 10:36 AM 8/14/2007, Eric Firing wrote:
Ted Drain wrote:
Manuel,
We do plots like this all the time. One thing we've found that's nice to have is a keyword that controls when the increase in y happens. We use a step style keyword that can be 'pre' (go up then right), 'post' (go right then up), and 'mid' (right 0.5, up, right 0.5).Good idea.
Regarding your patch, you might want to check other areas in MPL for data processing examples. I could be wrong but I'm not sure you can assume that incoming data is a float. Some of the unit conversion examples or the line collection code might have better examples.
Incoming data can be any numeric type, but it ends up getting converted to the default float type (not float32) internally.
Whenever possible, it is good to support masked array input.
Agreed - but the way the patch was written, I don't think it will support anything but float (especially not the unit types).
Eric
Ted
At 07:59 AM 8/14/2007, Manuel Metz wrote:Hi,
I have created a patch against latest svn that adds a function step to the axes class to plot step-functions
Manuel
Index: axes.py
--- axes.py (revision 3709)
+++ axes.py (working copy)
@@ -4995,6 +4995,18 @@
steps=[1, 2, 5, 10],
integer=True))
return im
+
+ def step(self, x, y, *args, **kwargs):
+ x2 = npy.zeros((2*len(x)), npy.float32)
+ y2 = npy.zeros((2*len(x)), npy.float32)
+
+ x2[0::2] = x
+ x2[1::2] = x
+
+ y2[1::2] = y
+ y2[2::2] = y[:-1]
+
+ self.plot(x2, y2, *args, **kwargs)class SubplotBase:
"""-------------------------------------------------------------------------
This SF.net email is sponsored by: Splunk Inc.
Still grepping through log files to find problems? Stop.
Now Search log events and configuration files using AJAX and a browser.
Download your FREE copy of Splunk now >> http://get.splunk.com/
_______________________________________________
Matplotlib-devel mailing list
[email protected]
matplotlib-devel List Signup and Options------------------------------------------------------------------------
-------------------------------------------------------------------------
This SF.net email is sponsored by: Splunk Inc.
Still grepping through log files to find problems? Stop.
Now Search log events and configuration files using AJAX and a browser.
Download your FREE copy of Splunk now >> http://get.splunk.com/------------------------------------------------------------------------
_______________________________________________
Matplotlib-devel mailing list
[email protected]
matplotlib-devel List Signup and Options------------------------------------------------------------------------
-------------------------------------------------------------------------
This SF.net email is sponsored by: Splunk Inc.
Still grepping through log files to find problems? Stop.
Now Search log events and configuration files using AJAX and a browser.
Download your FREE copy of Splunk now >> http://get.splunk.com/------------------------------------------------------------------------
_______________________________________________
Matplotlib-devel mailing list
[email protected]
matplotlib-devel List Signup and Options------------------------------------------------------------------------
------------------------------------------------------------------------
-------------------------------------------------------------------------
This SF.net email is sponsored by: Splunk Inc.
Still grepping through log files to find problems? Stop.
Now Search log events and configuration files using AJAX and a browser.
Download your FREE copy of Splunk now >> http://get.splunk.com/------------------------------------------------------------------------
_______________________________________________
Matplotlib-devel mailing list
[email protected]
matplotlib-devel List Signup and Options-------------------------------------------------------------------------
This SF.net email is sponsored by: Splunk Inc.
Still grepping through log files to find problems? Stop.
Now Search log events and configuration files using AJAX and a browser.
Download your FREE copy of Splunk now >> http://get.splunk.com/
_______________________________________________
Matplotlib-devel mailing list
[email protected]
matplotlib-devel List Signup and Options------------------------------------------------------------------------
Index: axes.py
--- axes.py (revision 3720)
+++ axes.py (working copy)
@@ -4987,7 +4987,54 @@
steps=[1, 2, 5, 10],
integer=True))
return im
+ + def step(self, x, y, *args, **kwargs):
+ '''
+ STEP(x, y, *args, **kwargs)
+ + Make a step plot. The args and keyword args to step are the same
+ as the args to plot. See help plot for more info.
+ + Additional keyword args for step:
+ + * where: can be 'pre', 'post' or 'mid'. Determines where the
+ step occurs.
+ '''
+ + where = kwargs.pop('where', 'pre')
+ + if not iterable(x): x = npy.ma.array().astype(npy.float32)
+ else: x = npy.ma.array(x).astype(npy.float32)
+ + if not iterable(y): x = npy.ma.array([y]).astype(npy.float32)
+ else: y = npy.ma.array(y).astype(npy.float32)
+ + if where=='pre':
+ x2 = npy.ma.zeros((2*len(x)-1,), npy.float32)
+ y2 = npy.ma.zeros((2*len(y)-1,), npy.float32)
+ + x2[0::2], x2[1::2] = x, x[:-1]
+ y2[0::2], y2[1:-1:2] = y, y[1:]
+ elif where=='post':
+ x2 = npy.ma.zeros((2*len(x)-1,), npy.float32)
+ y2 = npy.ma.zeros((2*len(y)-1,), npy.float32)
+ + x2[::2], x2[1:-1:2] = x, x[1:]
+ y2[0::2], y2[1::2] = y, y[:-1]
+ + elif where=='mid':
+ x2 = npy.ma.zeros((2*len(x),), npy.float32)
+ y2 = npy.ma.zeros((2*len(y),), npy.float32)
+ + x2[1:-1:2] = 0.5*(x[:-1]+x[1:])
+ x2[2::2] = 0.5*(x[:-1]+x[1:])
+ x2[0], x2[-1] = x[0], x[-1]
+ + y2[0::2], y2[1::2] = y, y
+ + return self.plot(x2, y2, *args, **kwargs)
+
class SubplotBase:
"""
Emulate matlab's(TM) subplot command, creating axes with------------------------------------------------------------------------
import matplotlib.numerix as npy
from pylab import *x = npy.arange(1.,10.)
y = arange(1.,10.)
x[4] += 0.4fig = figure()
ax = fig.gca()ax.step(x,y, where='post')
y += 1.
ax.step(x,y,where='pre')y += 1.5
ax.step(x,y,where='mid')xlim(0,10)
ylim(-1,13)show()
------------------------------------------------------------------------
------------------------------------------------------------------------
-------------------------------------------------------------------------
This SF.net email is sponsored by: Splunk Inc.
Still grepping through log files to find problems? Stop.
Now Search log events and configuration files using AJAX and a browser.
Download your FREE copy of Splunk now >> http://get.splunk.com/------------------------------------------------------------------------
_______________________________________________
Matplotlib-devel mailing list
[email protected]
matplotlib-devel List Signup and Options