Thanks so much. This is exactly what I’m looking for.
{x, y}_partial : matrix or string(s) , optional
Matrix with same first dimension as x, or column name(s) in data. These variables are treated as confounding and are removed from the x or y variables before plotting.
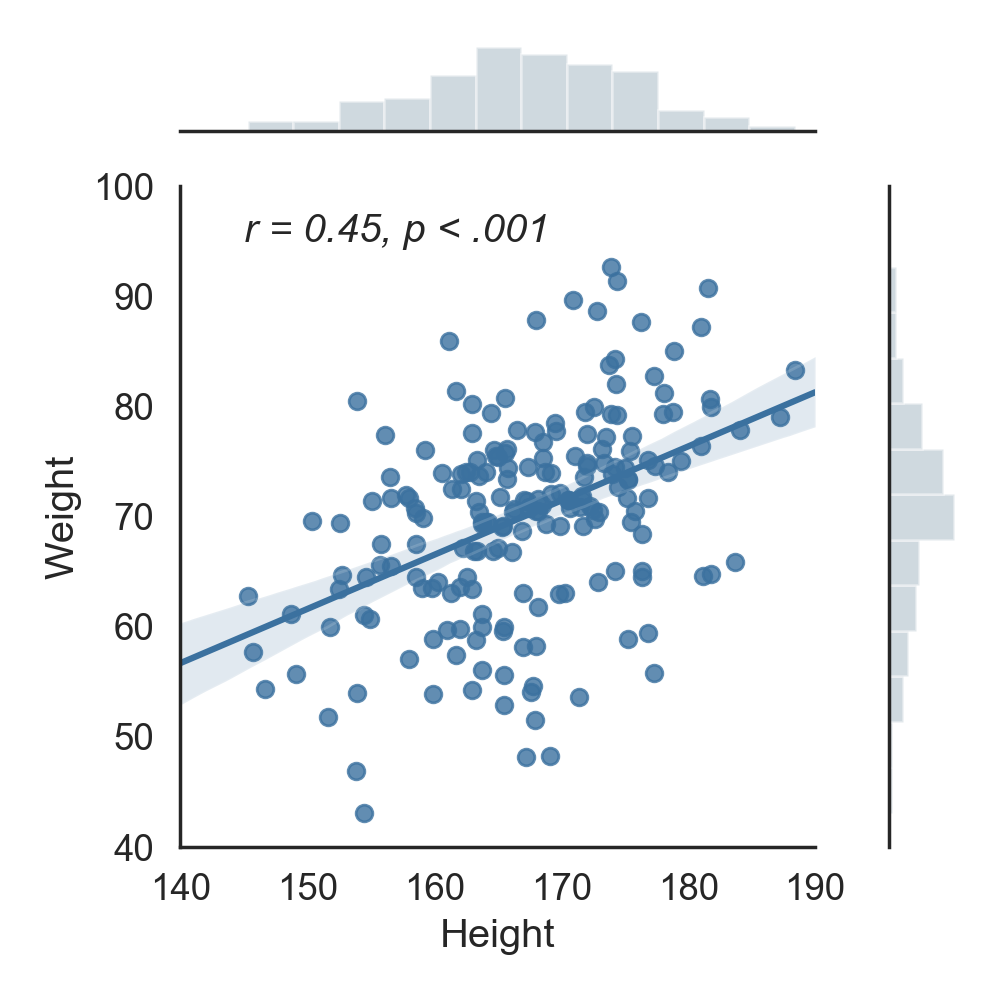
In addition, adding r and P-value to the plot.
Cdoe Examples (adapted from: https://pingouin-stats.org/generated/pingouin.partial_corr.html#pingouin.partial_corr)
Partial correlation with one covariate
import pingouin as pg
df = pg.read_dataset(‘partial_corr’)
pg.partial_corr(data=df, x=‘x’, y=‘y’, covar=‘cv1’)
n r CI95% r2 adj_r2 p-val BF10 power
pearson 30 0.568 [0.26, 0.77] 0.323 0.273 0.001055 37.773 0.925