Hello Matplotlib/Python users
I’m attempting to plot the residual regression plots with Pearson correlation coefficient and P-value in Python.
I’ve read an article regarding the simple correlation and linear regression: https://towardsdatascience.com/simple-and-multiple-linear-regression-with-python-c9ab422ec29c
What would be the best way to do it in Python?
Y=Continuous var
X=Continuous var
Nuisance covariate=Z (Continuous var)
Thanks for considering my request.
Matplotlib version
Operating system: Ubutnu 16.0.4
Matplotlib version: 3.1.1
Python version: 3.7/Anaconda 2019.10 for Linux Installer
Best regard
Larry Lai
What have you tried and what isn’t working? the blog post you linked recommends this:
fig = plt.figure(figsize=(10,7))
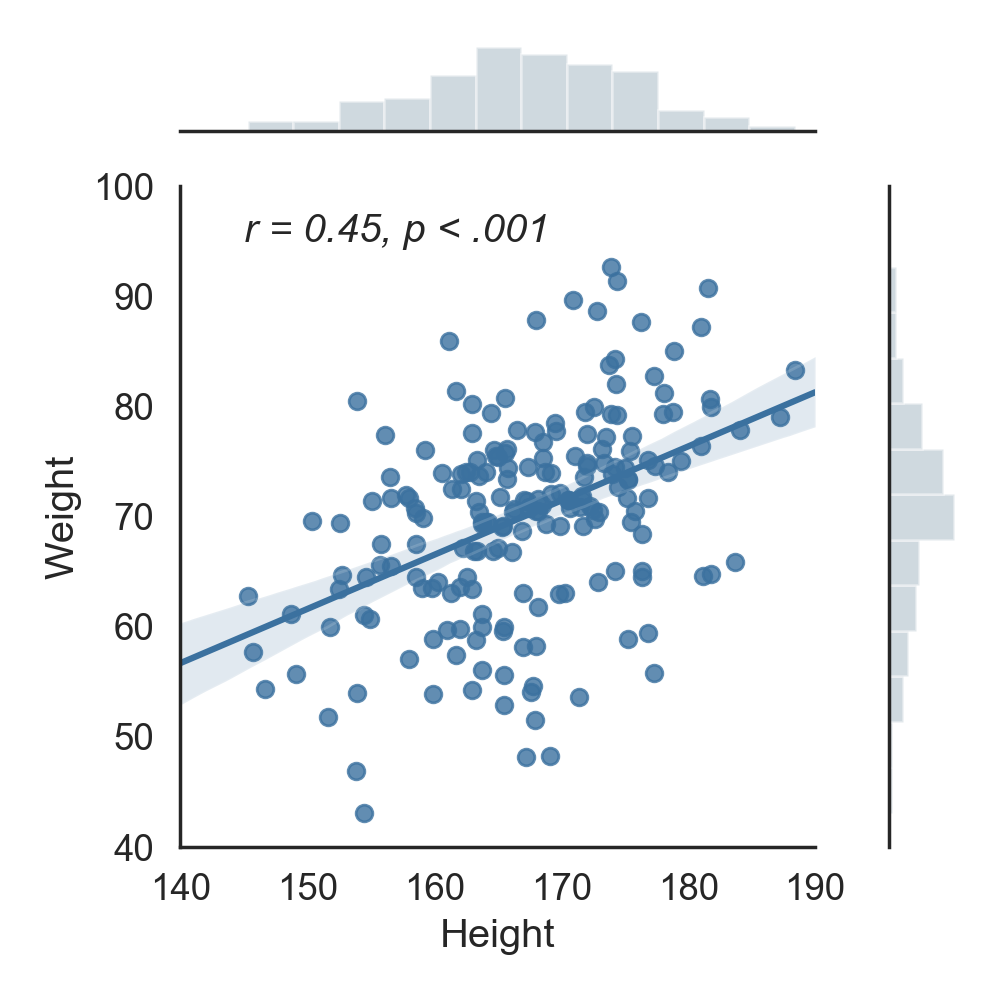
sns.residplot(df_females.Height, df_females.Weight, color='magenta')
# Title and labels.
plt.title('Residual plot 500 females', size=24)
plt.xlabel('Height (inches)', size=18)
plt.ylabel('Weight (pounds)', size=18)
Another option might be YellowBricks Residual Plots, but more information on what you’re trying to do would be helpful.
1 Like
Thanks for pointing that out.
I would like to insert Pearson correlation coefficient and P-value to the residual regression plot.
- Running partial correlation
- Running partial regression and insert the results from step 1.
I’m sorry, but I’m still a bit unclear on what you’re asking for. Do you have some code you can post?
If you’re trying to plot a line through the residuals, then seaborn’s residplot takes a lowess keyword argument that might do the trick:
lowess: boolean, optional
    Fit a lowess smoother to the residual scatterplot.
Thanks so much. This is exactly what I’m looking for.
{x, y}_partial : matrix or string(s) , optional
Matrix with same first dimension as x, or column name(s) in data. These variables are treated as confounding and are removed from the x or y variables before plotting.
In addition, adding r and P-value to the plot.
Cdoe Examples (adapted from: https://pingouin-stats.org/generated/pingouin.partial_corr.html#pingouin.partial_corr)
Partial correlation with one covariate
import pingouin as pg
df = pg.read_dataset(‘partial_corr’)
pg.partial_corr(data=df, x=‘x’, y=‘y’, covar=‘cv1’)
n r CI95% r2 adj_r2 p-val BF10 power
pearson 30 0.568 [0.26, 0.77] 0.323 0.273 0.001055 37.773 0.925
1 Like