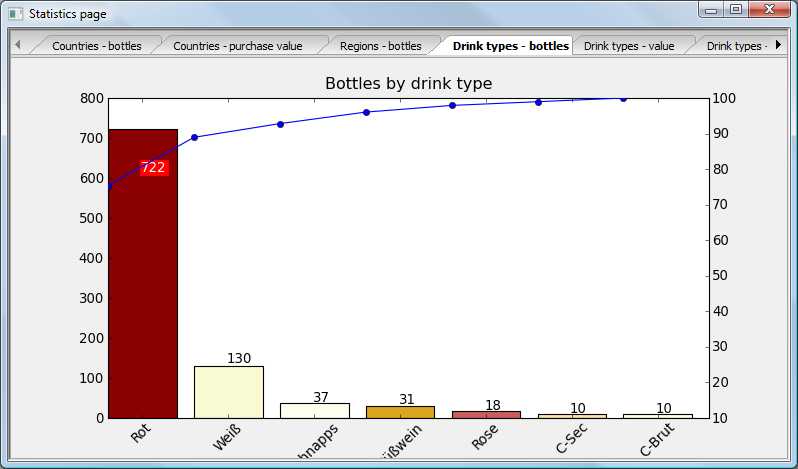
I trying to create a Pareto diagram and would like that the percentage
marker is center aligned on the bars, i.e. the blue point should be
center aligned on the bar instead of to be aligned on the left edge in
the following image.
The other problem I have is that the xtick_labels are cut off at the
bottom when the frame is resized below a certain size. How can I
prevent this?
Thanks for any tips on these problems.
Werner
Werner F. Bruhin wrote:
The other problem I have is that the xtick_labels are cut off at the bottom when the frame is resized below a certain size. How can I prevent this?
I don't think MPL yet has a system for making things fit, so you need to change the size/position of your axes object:
axes.set_position(pos, which='both')
"""
Set the axes position with:
pos = [left, bottom, width, height]
"""
these are in "figure units" which are relative to figure size, from 0 to 1. Unfortunately, what this means is that the amount of space for the axis labels varies with the size of the figure, as you've discovered.
The default for a single axes in a figure is:
(0.125, 0.1, 0.9, 0.9)
so you might try something like:
axes.set_position((0.125, 0.15, 0.9, 0.85) )
what is best depends on what size you want your figure to look good at.
-Chris
···
--
Christopher Barker, Ph.D.
Oceanographer
Emergency Response Division
NOAA/NOS/OR&R (206) 526-6959 voice
7600 Sand Point Way NE (206) 526-6329 fax
Seattle, WA 98115 (206) 526-6317 main reception
[email protected]...
Chris,
Christopher Barker wrote:
Werner F. Bruhin wrote:
The other problem I have is that the xtick_labels are cut off at the bottom when the frame is resized below a certain size. How can I prevent this?
I don't think MPL yet has a system for making things fit, so you need to change the size/position of your axes object:
axes.set_position(pos, which='both')
"""
Set the axes position with:
pos = [left, bottom, width, height]
"""
these are in "figure units" which are relative to figure size, from 0 to 1. Unfortunately, what this means is that the amount of space for the axis labels varies with the size of the figure, as you've discovered.
The default for a single axes in a figure is:
(0.125, 0.1, 0.9, 0.9)
so you might try something like:
axes.set_position((0.125, 0.15, 0.9, 0.85) )
what is best depends on what size you want your figure to look good at.
Thanks for this tip, will play around with this a bit. First try shifts the figure of the panel on the top left and right, so this will need a bit more digging on my part.
Werner