Overlapping plots without using subplots

Hello there!

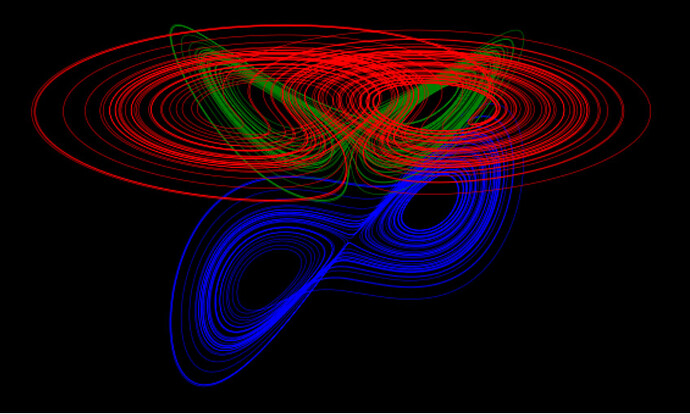
Inspired by the below image (more here), I’m trying to plot several graphs side-by-side (so to speak) and overlapping to some degree.

Up to now, I tried the following command:

plt.figure(figsize=(10,6))
plt.plot(x,y,'b', linewidth=0.5)
plt.plot(x,z,'g', linewidth=0.5) 
plt.plot(y,z,'r', linewidth=0.5)
plt.axis('off')

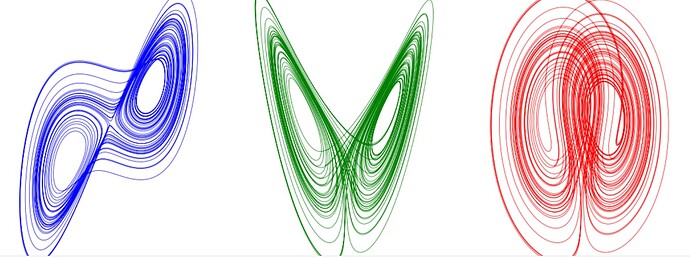
And I get this (disregard the dark background):

I tried the subplot to no avail:

plt.figure(figsize=(13, 6), dpi=100)
plt.subplot(1, 3, 1) # fila 1, columna 3, index 1
plt.plot(x,y,'b', linewidth=0.5), plt.axis('off')
plt.subplot(1, 3, 2)
plt.plot(x,z,'g', linewidth=0.5), plt.axis('off')
plt.subplot(1, 3, 3)
plt.plot(y,z,'r', linewidth=0.5), plt.axis('off')

As you can see, there is no overlapping, yet there are side-by-side:

According to the person at the lab, he created that image using “zorder”… but I’ve been playing with that and I didn’t get any result close to the one showed first.

Hence, any hints? Happy to listen to your thoughts.

Had you considered using one plot, but skewing the x-ordinates of the data for each line plot? Thus skewing their horizontal positions?

Hi… Thanks for answering…Can you elaborate a little bit more, please? The “x”-ordinate among plots can be different. Actually, in different orders of magnitude.

Ah, you’ve got multiple x-axes on the plot then? I presumed they were
sharing a common x-axis. On that presumption I was suggesting adding an
offset to the x-values for the plots to shift then sideways.

You could still do this if the plots have very different scales by
computing new x-ordinates for each plot all scaled to the same range eg
the range of the plot with the widest min(x),max(x) difference. Having
done that you could then add an offset to the scaled x-values to shift
each place as desired.

I think the key idea here is to plot all the lines on the same x-axis so
that the layout has to obey your poisitioning, rather than centring each
plot on its own x-axis.

Cheers,
Cameron Simpson cs@cskk.id.au

···

On 13Oct2022 00:15, Martin via Matplotlib nobody@discourse.matplotlib.org wrote:

Hi… Thanks for answering…Can you elaborate a little bit more,
please? The “x”-ordinate among plots can be different. Actually, in
different orders of magnitude.