Overlapping of scientific notation exponents with twin axes

Hello everyone.
I am creating a plot with twin axes, wether it is along X or Y axis. I use the constrained layout option to get all the axes to be displayed with homogeneous spacing between them.
Everything works fine with this setup but I face a small issue.

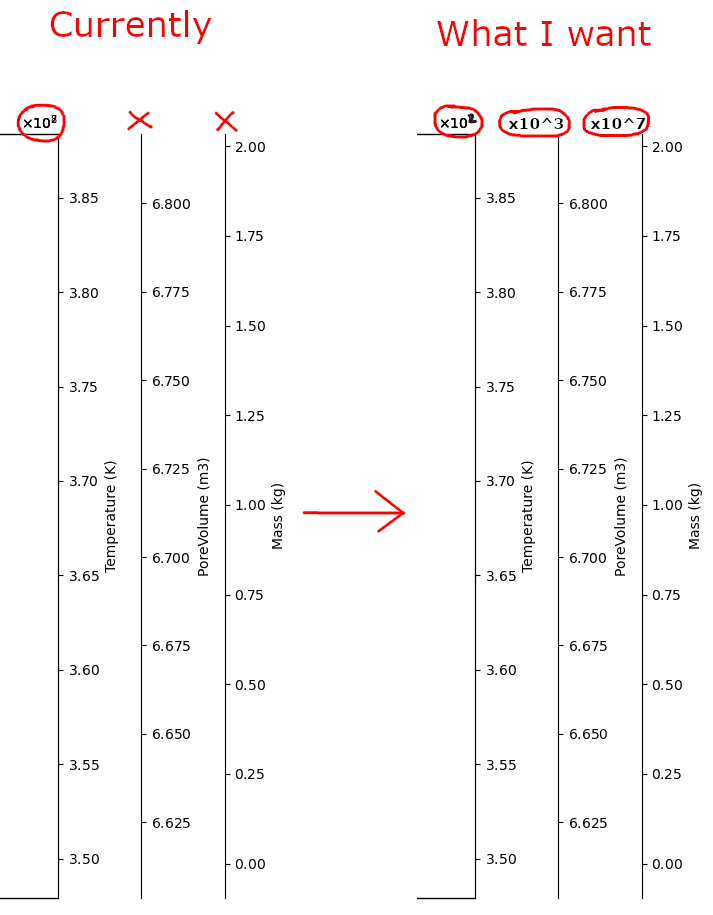
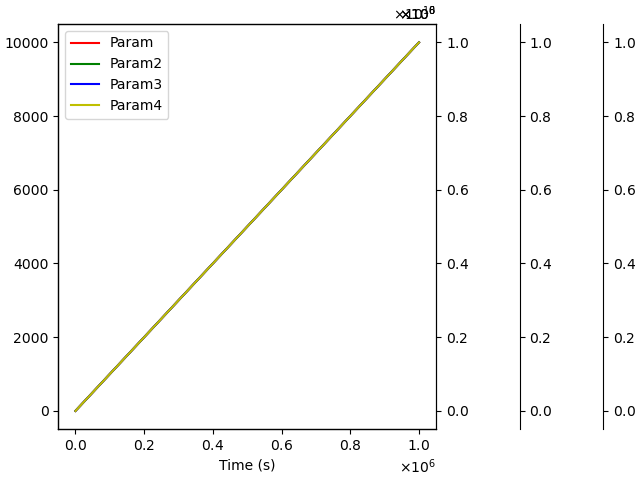
I am plotting mutliple types of data on my axes and depending on the axes, the data range can be quite different from [0, 10] up to [0, 1e20] and therefore I am using scientific notation. And this is where my problem is : the exponents of the scientific notations for each of my axes overlap on the same spot.

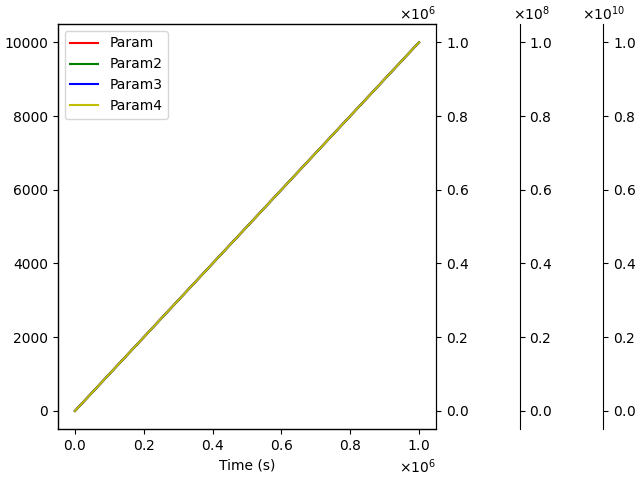
How can I change to make it look as in my picture below ?

Thanks a lot,
Have a great day.

Do you have some example code to look at?

Yes, here is a simple example reproducing that behaviour :

Figure_1

import matplotlib.pyplot as plt
import numpy as np


x = np.linspace(0, 1e6, 20)
y = np.linspace(0, 1e4, 20)
y2 = np.linspace(0, 1e6, 20)
y3 = np.linspace(0, 1e8, 20)
y4 = np.linspace(0, 1e10, 20)

fig, ax = plt.subplots(constrained_layout=True)
all_ax = [ax]
ax.set_xlabel("Time (s)")
ax.ticklabel_format(style='sci', axis='x', scilimits=(0, 0), useMathText=True)

ax2 = ax.twinx()
ax3 = ax.twinx()
ax4 = ax.twinx()

ax2.spines['right'].set_position(('outward', 0))
ax3.spines['right'].set_position(('outward', 60))
ax4.spines['right'].set_position(('outward', 120))

ax2.ticklabel_format(style='sci', axis='y', scilimits=(0, 0), useMathText=True)
ax3.ticklabel_format(style='sci', axis='y', scilimits=(0, 0), useMathText=True)
ax4.ticklabel_format(style='sci', axis='y', scilimits=(0, 0), useMathText=True)

ax.plot(x, y, label="Param", color="r")
ax2.plot(x, y2, label="Param2", color="g")
ax3.plot(x, y3, label="Param3", color="b")
ax4.plot(x, y4, label="Param4", color="y")

line, label = ax.get_legend_handles_labels()
line2, label2 = ax2.get_legend_handles_labels()
line3, label3 = ax3.get_legend_handles_labels()
line4, label4 = ax4.get_legend_handles_labels()

ax.legend(line+line2+line3+line4, label+label2+label3+label4, loc='best')
plt.show()

So there is definitely a bug here in that the offset should move with the spine, just like the tick labels and the Axis label, which looks to be Offset text positions not implemented · Issue #4476 · matplotlib/matplotlib · GitHub.

The good news is the automatic positioning is only on the other (y) direction. The bad news is that it uses Axes units for x-position, which is not the same as the ‘outward’ units. So you have to fudge it a bit; I’ve found that the following works alright for the default window size:

ax3.yaxis.offsetText.set_position((1.3, 0))
ax4.yaxis.offsetText.set_position((1.5, 0))

(Note, the y position specified here doesn’t matter as it is refreshed at draw time, so I used 0 for simplicity.) But since that the x-position is in Axes units, you can’t resize the figure horizontally afterwards.
Figure_1