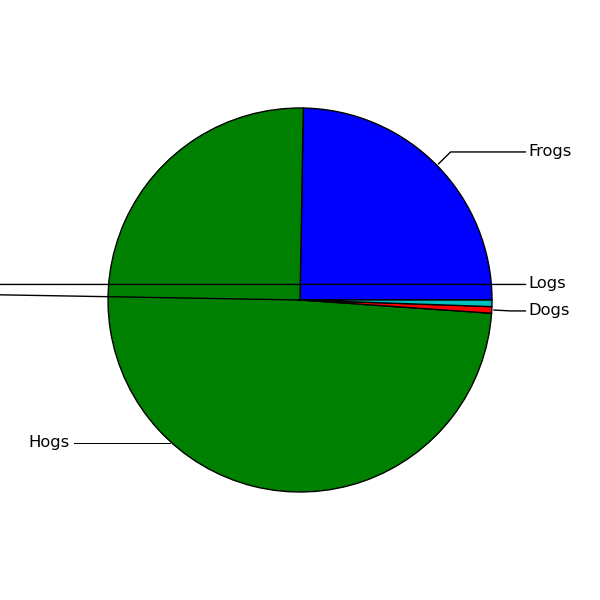
Hello again, and thank you very much for the answer, suddenly it all got
much clearer to me. The only 'issue' I am having is (from screenshot) what
happens to the line pointing to Logs when I try to offset it a little bit on
the Y axis. It looks like either the angleA or angleB is wrong, but I don't
see and reason why it would be as the X coordinates does not change.
Another thing I do not quite understand is what that patchB does.
figure\(1, figsize=\(6,6\)\)
ax = axes\(\[0\.1, 0\.1, 0\.8, 0\.8\]\)
labels = 'Frogs', 'Hogs', 'Dogs', 'Logs'
fracs = \[45, 135 ,1, 1\]
p = pie\(fracs\)
foo = None
for p1, l1 in zip\(p\[0\], labels\):
r = p1\.r
dr = r\*0\.1
t1, t2 = p1\.theta1, p1\.theta2
theta = \(t1\+t2\)/2\.
xc = cos\(theta/180\.\*pi\)\*r
yc = sin\(theta/180\.\*pi\)\*r
x1 = cos\(theta/180\.\*pi\)\*\(r\+dr\)
y1 = sin\(theta/180\.\*pi\)\*\(r\+dr\)
if x1 > 0 :
x1 = r\+2\*dr
ha, va = "left", "center"
cstyle="angle,angleA=180,angleB=%f"%\(\-theta,\)
print >> sys\.stderr, ha, ",A,", va
else:
x1 = \-\(r\+2\*dr\)
ha, va = "right", "center"
cstyle="angle,angleA=0,angleB=%f"%\(theta,\)
print >> sys\.stderr, ha, ",B,", va
if foo:
if theta \- foo < 10:
print >>sys\.stderr, "Overlapping, offsetting a little
bit"
y1 = y1 + 0.1
foo = theta
annotate\(l1,
\(xc, yc\), xycoords="data",
xytext=\(x1, y1\), textcoords="data", ha=ha, va=va,
arrowprops=dict\(arrowstyle="\-",
connectionstyle=cstyle,
patchB=p1\)\)
- Rune
2010/3/23 Jae-Joon Lee <lee.j.joon@...287...>
This should be doable using the annotation. Here is a simple cook-up I
just did. it uses a naive algorithm to place the labels, but I guess
it gives you an idea how things work.
a screenshot is attached.
Regards,
-JJ
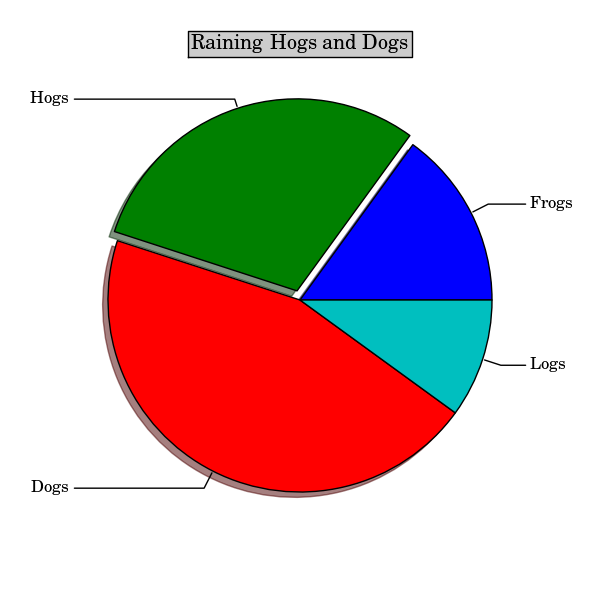
from pylab import *
# make a square figure and axes
figure(1, figsize=(6,6))
ax = axes([0.1, 0.1, 0.8, 0.8])
labels = 'Frogs', 'Hogs', 'Dogs', 'Logs'
fracs = [15,30,45, 10]
explode=(0, 0.05, 0, 0)
p = pie(fracs, explode=explode, shadow=True)
title('Raining Hogs and Dogs', bbox={'facecolor':'0.8', 'pad':5})
for p1, l1 in zip(p[0], labels):
r = p1.r

dr = r*0.1

t1, t2 = p1.theta1, p1.theta2

theta = (t1+t2)/2.


xc, yc = r/2.*cos(theta/180.*pi), r/2.*sin(theta/180.*pi)

x1, y1 = (r+dr)*cos(theta/180.*pi), (r+dr)*sin(theta/180.*pi)

if x1 > 0 :

    x1 = r+2*dr

    ha, va = "left", "center"

    tt = -180

    cstyle="angle,angleA=0,angleB=%f"%(theta,)

else:

    x1 = -(r+2*dr)

    ha, va = "right", "center"

    tt = 0

    cstyle="angle,angleA=0,angleB=%f"%(theta,)


annotate(l1,

         (xc, yc), xycoords="data",

         xytext=(x1, y1), textcoords="data", ha=ha, va=va,

         arrowprops=dict(arrowstyle="-",

                         connectionstyle=cstyle,

                         patchB=p1))
show()